Chris Stanley

We’re excited to announce the release of Response Webhooks, our most highly requested feature over the past few months. Developers can now directly call API endpoints in Patterns to execute workflows, and get the resulting response from those workflows all in a single HTTP request. This unlocks major use cases such as calling Patterns directly from a client app. Now you can build a chat interface in React and leverage Patterns as your agent-based GPT backend.

One of the most common use cases for Patterns is to integrate with external systems. Before Response Webhooks, if developers wanted to call an endpoint, execute a workflow, and get a response they’d have to POST to a webhook and setup a callback URL to ingest the response. This works well for some use cases but not for others, now with Response Webhooks, you can call Patterns directly and wait for a response synchronously.

Using Response Webhooks

resp webhook Link to docs

There are now two types of webhooks you can use in Patterns depending on your use case. The first type is an ingest only webhook that will return immediately with an empty response body after calling it. The second is an ingest and respond webhook. When you call an ingest and respond endpoint, it will add a field named patterns_request_key when it writes the record to its Table. In a Python node, you can pass that request key to the function respond_to_request along with a payload which will be sent as the body of the webhook response.

response.py
from patterns import (
Table,
respond_to_request
)

webhook_table = Table("webhook")

for record in webhook_table.as_stream():
request_key = record["patterns_request_key"]

# The response_payload will be sent to the webhook identified by the response_key.
# It can contain any value that can be encoded to json.
response_payload = {"hello": "world", "count": 2}
respond_to_request(request_key, response_payload)

Webhooks Video Tutorial

Jon Travis

Announcing Auto Code, Patterns' new conversational interface which allows you to use AI to create Python and SQL to extract insights from your data. It's powered by OpenAI's GPT-3 and gives you an instant productivity boost.

Auto Code enables technical users to move even faster by allowing them to describe what they want in English. Auto Code knows the shape of your data, how it is connected, and what APIs are available. It uses this information to generate code that works with your specific data.

In this blog, I'll show you how to get started with Auto Code and how it works behind the scenes.

You can follow along with these directions to try it out yourself. You'll need a Patterns account and an empty graph. Your generated code may look different from mine, depending on whatever randomness OpenAI injects.

(Note: there are still some programmerish concepts in the prompts like rows, records, and snake case ... but you get the idea.)

When we are all done, our final graph will look like this:

button bar

Invoke Auto Code

Auto Code is a new button at the top of the graph. Click it to open the conversational interface.

button barauto code dialog

The Auto Code dialog reads like a sentence that you must complete. Just tell it what you want to do, and it will create the code for you. For example: With a Python node add a timestamp to my users.

Building with Auto Code

Let's see how Auto Code works by building a simple graph that plays with air quality data from New York. We'll start with a blank graph and build it up using Auto Code.

Import the air quality CSV

The air quality report is a publicly available CSV. Bring the data into Patterns by using Auto Code to create a Python node with the following text:

Download the air quality csv from "https://data.cityofnewyork.us/api/views/c3uy-2p5r/rows.csv?accessType=DOWNLOAD", 
convert each row to a dict with snake case names,
and write it to a table
prompt to download csv

Configure the output store for the newly created node and Run it. If all goes well, Patterns will import the CSV and create a table called air_quality.

csv node code and data table

Find min and max sulfur dioxide values

Now let's find out the minimum and maximum sulfur dioxide values for each place.
(Note: This actually took a few attempts to get right, because there are somewhat similar names in the data we're examining, name and place_name.)

Open Auto Code to create a SQL node with the following text:

Get a list of all air quality records and
calculate the min and max data value for each place name,
but only if the name starts with Sulfur
sort by the max value

Run the node to execute the generated SQL. You should see something like this:

minmax node code and data table

Notice that Auto Code automatically understands which tables to pull data from and which columns are needed to satisfy the request.

Behind the scenes

So how does Auto Code work? How does it know which tables, columns, and APIs are available? The answer lies in how the prompt is created and sent to OpenAI.

Generating Python nodes

To generate Python nodes, Patterns creates a prompt which augments the user's input with:

  1. a list of all the tables and fields within a graph
  2. a list of commonly used functions in the patterns-devkit library
  3. an example of a user input + possible answer
  4. the real user input and beginning of the answer

An example prompt sent to OpenAI might look like this:

SQL tables (and columns):
* output_table(geo_place_name, min_data_value, max_data_value)
* air_quality(unique_id, indicator_id, name, measure, measure_info, geo_type_name, geo_join_id, geo_place_name, time_period, start_date, data_value, message, patterns_id)

The patterns-devkit library:
```
class Table:
[ ... trimmed ... ]

def read(cls, as_format: str = "records") -> List[dict]:
"""Read records from this table.

Args:
as_format: Format to return records in. Defaults to list of dicts ('records').
Set to 'dataframe' to get pandas dataframe (equivalent to ``read_dataframe``)
"""
...

def read_sql(cls, sql: str, as_format: str = "records") -> List[dict] | DataFrame:
"""Read records resulting from the given sql expression, in same manner as ``read``.

To reference tables in the sql, you can get their current (fully qualified and quoted)
sql name by referencing `.sql_name` or, equivalently, taking their str() representation::

my_table = Table("my_table")
my_table.read_sql(f'select * from {my_table} limit 10')

Args:
sql: The sql select statement to execute
as_format: Format to return records in. Defaults to list of dicts ('records').
Set to 'dataframe' to get pandas dataframe.
"""
...

def append(cls, records: DataFrame | List[dict] | dict):
...

def upsert(cls, records: DataFrame | List[dict] | dict):
...

[ ... trimmed ... ]
```

Python code using the patterns-devkit library that "list all customers with a customer_id of 333":
```
from patterns import Table

customers_table = Table("customers")
results_table = Table("results", mode="w")

records = customers_table.read_sql(
"SELECT * FROM {} c WHERE c.customer_id = {}".format(customers_table, 333)
)
results_table.append(records)
```

Python code using the patterns-devkit library that "list all air quality rows and print them out":
```
from patterns import Table

Generating SQL nodes

To generate SQL nodes, Patterns creates a prompt with a similar structure to the Python prompt. An example prompt sent to OpenAI might look like this:

SQL tables (and columns):
* output_table(name, min_value, max_value)
* air_quality(unique_id, indicator_id, name, measure, measure_info, geo_type_name, geo_join_id, geo_place_name, time_period, start_date, data_value, message, patterns_id)


PTSQL is a SQL dialect that is identical to PostgreSQL, but references tables differently.

A PTSQL query that "list the row_ids from a table named Foo":
```
SELECT f.row_id
FROM {{ Table("Foo") }} f
```

A PTSQL query that "get a list of all air quality records, calculate the min and max data value for each place with a name starting with Sulfur":
```

Why conversational interfaces?

Software is complex, despite our greatest attempts at simplifying it. Products promise great power, more productivity, and simpler lives for their users. But the reality is that most of us are not experts in the tools we use, because becoming proficient in any tool takes time and effort. The primary barrier for people to succeed with any tool is the learning curve.

So how do products attempt to solve this barrier to learning?

  • Teaching
    • documentation
    • tutorial videos
    • blogs
    • community forums
  • Expert-created starting points
    • templates
    • components
  • UI helpers
    • wizards
    • auto-complete / intellisense
    • coach marks
    • contextual help

Enter the conversational interface

Conversational interfaces are a new(ish) way to interact with software, and they help reduce the barrier to learning by allowing software to understand written human intent. They are a natural extension of the way we communicate with each other. Ask a computer to do something as you would ask any other person.

Search engines originally pioneered this type of interface a long time ago. When search was first introduced, it was largely based off simple keyword matching indexes.
Google: ramen recipe

But as search engines became more sophisticated they began to understand the intent behind questions, and queries became more conversational.
Google: how do I make the best ramen?

Now, these powerful interfaces are available to any developer who has access to a Large Language Model (e.g. from OpenAI, Google, etc.).

Expect to see an explosion of conversational interfaces in the coming years! Software is complex, but if it can understand human intent, it will reduce the learning curve and remove barriers to success.

Matthew Mitchener

The app that I built as part of this graph can be viewed and cloned here: https://studio.patterns.app/graph/sx5yykfi7u34ut7pvae4

I'm a big fan of the search experience provided by Algolia. It's super simple to implement and comes with a ton of rich features out of the box, such as contextual search results, typo tolerance, synonyms, and filtering stop words. Since Algolia can accurately retrieve blocks of relevant content, I had an idea: why not inject this search content into OpenAI's text completion prompt and see if I could generate an Algolia-powered GPT-3 chatbot?

Accomplishing this turned out to be surprisingly simple. All I did was feed the search results into OpenAI's text completion prompt and follow that up with a question. The result was quite solid.

algolia powered GPT-3 slackbot

And here’s what my prompt looked like:

Answer:
We can then upload and publish our component to our organization with the devkit command patterns upload path/to/graph.yml --publish-component . (You may see “graph errors” when you upload a component that has an unconnected input or unfilled parameter, these are ok to ignore, since they will be connected by users of your component) Now if we run patterns list components we should see it included in the output
Click on the +Add button and select a Python node to add to your graph
Graph's have an add button in the top left corner of the graph that provide a dropdown of Nodes that can be added to the graph. You can also use the
etc...

Question:
how do I add a node to my graph?

What's great about this solution is that OpenAI's text-davinci-002 model has a prompt limit of 2048 tokens. Therefore, it's impossible to pass our entire documents into a prompt. However, passing in search results used only around 1k tokens. You could also fine-tune your own model, but that would require a lot more work to maintain, and you run the risk of overfitting.

Be aware that 1k tokens with text-davinci-002 cost around $0.02

There were some Algolia search results that weren't relevant, such as information about GDPR and creating schemas. However, these irrelevant blocks did not affect the end result when it came to OpenAI predicting the next text completion for my question.

Passing context to OpenAI’s text completions

After this first part worked well, I thought it would be neat if the Slackbot could retain the context of the thread even if a non-question response or follow-up question was asked. Slack provides a unique thread ID, so I used this to fetch the entire conversation and appended it after the search results in my new prompt.

algolia powered GPT-3 slackbot

Learnings

It’s amazing how well this works, but there are still a few limitations:

  1. If the topic of a follow-up question is unrelated to the search results of the original question, the bot may struggle to provide an accurate response.
  2. Algolia search can be configured to prioritize marketing content over more helpful documentation. It's important to be mindful of how search is implemented to provide the best chat experience.

Conclusion

OpenAI's text completion API combined with text search can be a powerful tool for creating a bot that specializes in any given topic. If your organization uses Algolia and Slack, you can simply clone my graph and follow the setup instructions.

Ken Van Haren

(fyi, here’s the code for everything I built below, you can clone and deploy the full app here as well.)

“AskHN” is a GPT-3 bot I trained on a corpus of over 6.5 million Hacker News comments to represent the collective wisdom of the HN community in a single bot. You can query it here in our discord using the /askhn command if you want to play around (I’ve rate-limited the bot for now to keep my OpenAI bill from bankrupting me, so you might have to wait around for your spot).

More details on how I built it below, but I found the LLM-embedded embodiment of HN’s wisdom to be an impressive and genuinely useful resource. Thousands of the sharpest minds in technology have volunteered up their expertise, wisdom, and occasional flame over the years. There are very few topics Ask HN Bot does not have a solid answer to, even the question of finding love!

It does well with job advice:

google

...classic flame wars:

ds

...the important questions:

love

...and unanswerable questions:

bi

The GPT-3 prompted summaries are pretty good! And the linked articles are all very relevant -- the 1500 dimensions of the OpenAI GPT embeddings are enough to slice the semantic space for this use case.

It's main failure mode is summarizing contradictory / irrelevant comments into one response, which can lead to incoherence.

How I built it

I built it in Patterns Studio over the course of a few days. Here was my rough plan at the start:

  1. Ingest the entire HN corpus (bulk or API) - 34.8 million stories and comments as of this writing
  2. Play around with filtering to get the right set of content (top articles, top comments)
  3. Bundle article title and top comment snippets into a document and fetch the OpenAI embedding via text-ada-embedding-002
  4. Index the embeddings in a database
  5. Accept questions via Discord bot (as well as manual input for testing)
  6. Look-up closest embeddings
  7. Put top matching content into a prompt and ask GPT-3 to summarize
  8. Return summary along with direct links to comments back to Discord user

This plan went ok, but results tended to be a bit to generic — I didn’t have enough of the specific relevant comment content in the prompt to give technical and specific answers. Embedding every single one of the 6.5 eligible comments was prohibitively time-consuming and expensive (12 hours and ~$2,000). So I ended up with this extension for step 6:

  1. Look-up closest embeddings (stories)
    1. With list of top N matching stories, get embeddings for all top comments on the stories at question-answering time
    2. compute embeddings and similarity and choose top K comments closest to question
    3. Put top matching comments into a prompt and ask GPT-3 to answer the question using the context

Let's dive into details for each of the steps above.

Ingesting and filtering HN corpus

Using the firebase API, downloaded the entire ~35m item database of HN comments and stories in parallel. This took about 30 minutes and left us with 4.8m stories and 30m comments. I filtered the stories to just those with more than 20 upvotes and at least 3 comments, this left me with 400k stories over the entire 17 year history of HN. I then further filtered to stories from the last 5 years, leaving us with a final number of 160k stories. For eligible comments, I filtered to those on an eligible story with at least 200 characters, for ~6.5 million comments total.

GPT embeddings

To index these stories, I loaded up to 2000 tokens worth of comment text (ordered by score, max 2000 characters per comment) and the title of the article for each story and sent them to OpenAI's embedding endpoint, using the standard text-embedding-ada-002 model, this endpoint accepts bulk uploads and is fast but all 160k+ documents still took over two hours to create embeddings. Total cost for this part was around $70.

The embeddings were then indexed with Pinecone.

Discord bot

For a user interface, I decided to implement AskHN as a Discord bot. Given that I needed to rate limit responses, having a Discord bot (over a dedicated web app, for instance) would allow for a more fun and collaborative experience of folks sharing questions and answers, even if any given individual did not get a chance to ask a question.

Answering the question

With the embeddings indexed, and our bot live, responding to a given question involved the following steps:

  1. Give an immediate reply telling the user if we are working on the question or if the user has been rate limited.
  2. Compute the embedding of the question and query Pinecone for top three most similar stories
  3. Collect all top comments from all three stories, compute embeddings for all of these comments, and then rank by similarity to the question's embedding
  4. Concatenate most similar comments (up to max 1000 tokens per comment) until max tokens limit reached (3500)
  5. Build prompt with comments as context and send to GPT-3 to produce an answer

There are often dozens or even hundreds of relevant comments that we get the embeddings for, luckily embeddings are cheap and fast, so the cost of this is much less than even the single call to GPT-3 for the completion.

With the top comments text in hand we build the final prompt for GPT-3 as:

prompt = f"""{top_comments}

Answer the following question by summarizing the above comments (where relevant),
be specific and opinionated when warranted by the content:

Question: "{question}"

Answer: """

I played around with a number of prompts, but the main thing is to get GPT-3 to break out of its "Generic Helpful Internet Article" voice and take a more opinionated stance when warranted. So I told it to do that, and it did :)

Conclusion

The methodology I used here is a generic, scalable solution for distilling a knowledge corpus into an embodied intelligence. Would I use a bot like this over hn.algolia.com? Maybe, maybe not. Would I appreciate this service added onto Algolia results page? Absolutely 100%.

Just shoot me an email Algolia, kvh@patterns.app, happy to help!

Building your own question-answering bot on any corpus

This same architecture and flow would work well for almost any text corpus and question-answering bot. If you have such a use case, please feel free to reach out to me kvh@patterns.app anytime to discuss my learnings or apply for our CoDev program at Patterns. You can get started by cloning the template for this bot.

Ken Van Haren

(fyi, here’s the code for everything I built below, you can play around with it in Patterns Studio as well.)

I discussed replacing a SQL analyst with recursive GPT prompts in my last post, in which I had some surprising, but limited, success getting GPT to answer analytical questions with SQL. Astute commenters on HN were quick to point out I hadn’t really replaced anyone:

hn

Both the comment and the reply have merit — analysis is hard! The reality is that no SQL analyst is productive at a company on day one. You must learn the tables, the business, and the quirks of logic. Additionally, an analyst is responsible for not just producing the correct SQL and result, but working iteratively with the stakeholder and communicating the result effectively and with the right context.

Well, .... can GPT do these things too?

Can we teach it the quirks of our dataset over time? Can we get it to produce charts to visually communicate its results? Can we have it work interactively to refine and drill in to answers?

I gave it a go with a few more hours of my time. Last time I used the Crunchbase database to build CrunchBot to answer fundraising related questions. This time, I used a public postgres database filled with mock ecommerce data, a data source anyone could play with. I call it ChartBot. Could it replace Tableau at your organization? Read on to find out, but here is a quick review of my success...

chartbot

...and failure (valiant effort, this is tough one!):

chartbot

Here's it getting a SQL query correct, but missing the right date filters

chartbot

And me editing the SQL, sending it back, and getting the correct result:

chartbot

Overall, I found ChartBot to be quite good at producing basic charts and analytics, and the ability to refine and resubmit a response really changes the practical value of the bot. It suffers in handling more complex analytical queries (like monthly cohort repurchase rates) but so would any human with no extra context or help.

How I built it

The idea was to augment my existing SQL bot with these new capabilities:

  • Ability to fulfill a request for a chart or visualization
  • Ability to handle raw (corrected) sql and execute it
  • Ability to detect and route between all the intents

Here's the flow I ended up with:

  • Detect intent of message: data request, chart request, or SQL request
  • If data request:
    • GPT completion to generate candidate SQL
    • Completion to double check the SQL
    • Run the SQL
    • If errors, ask GPT to fix and then re-run the SQL
    • Run the above steps as many times until successful result or hit limit (5) attempts
  • If chart request
    • Run the above SQL pipeline, but asking GPT to generate the necessary data for the requested chart
    • Take the resulting data and feed a sample into a prompt asking GPT to produce a matplotlib chart
    • Attempt to exec() the resulting python code and capture the matplotlib output
    • If errors, ask GPT to fix and re-run
    • Run the above steps as many times until successful result or hit limit (5) attempts
  • If SQL request
    • Extract the raw SQL from the request
    • Run the SQL
  • Return all and any results or errors via Slack

There are many obvious extensions and improvements to this flow, the biggest one being iterative refinement with ChartBot to fix and develop more complex answers. We will save these for part III.

Prompt routing

First, I needed to detect the intent of the message and route to the correct flow.

Here’s the prompt I used to route the requests:

prompt = f"""Classify the following message according to whether it is a SQL query, a data request, or a chart request. Examples:

message: how many new customers were added last year?
class: data request

message: what's the average LTV of a customer?
class: data request

message: show me the trend in house prices over the last 5 years
class: chart request

message: plot a graph of miles vs heartrate, grouped by age group
class: chart request

message: SELECT * FROM customers ORDER BY date
class: sql query

message: {question}
class:
"""

I spent a couple minutes making this list, never touched it again, and it never failed to do the right thing. GPT-3 absolutely crushes these type of general language classification tasks.

Charting with Matplotlib

Charting turned out to be pretty straight forward as well: Ask gpt to write the sql for the data for the requested chart, then ask it to write matplotlib code given the sql result to produce the chart.

To generate the data, I used a prompt very similar to the original SQL generating prompt:

prompt = f"""{tables_summary}

As a senior analyst, given the above schemas and data, write a detailed and correct
Postgres sql query to produce data for the following requested chart:

"{question}"

Comment the query with your logic."""

(The "as a senior analyst" bit has no effect as far as I can tell, you can say "as a bumbling new-hire analyst" and it seems to do just as well, but no harm in hyping GPT up a bit)

This then went through the same original error-correcting prompt loop as in the original SQL bot. We then run the SQL, producing a data set that we can feed into our python charting code.

To build the matplotlib charting prompt, we show GPT the data we got in the previous step and ask it to write matplotlib code. Which it does. I had more luck giving it a pandas dataframe then raw dicts for the input data:

prompt = f"""

records_df = pd.DataFrame.from_records({result})

As a senior analyst, given the above data set, write detailed and correct
matplotlib code to produce a chart as requested:

"{question}"

Comment the code with your logic.

```python
# Import the necessary libraries
import matplotlib.pyplot as plt
import pandas as pd

# Load the data into a pandas dataframe
records_df = get_data()

"""

We then raw exec() the resulting python code — nightmare fuel for the AI safety crowd — and run the code through a error-correcting pipeline similar to the one we used for SQL.

Here’s an example of it doing a great job correcting a simple mistake — can you catch it?

# import the necessary libraries
import matplotlib.pyplot as plt
import pandas as pd

# Load the data into a pandas dataframe
records_df = get_data()

# subset to only series a rounds
series_a = records_df[funding_rounds['investment_type'] == 'series_a']

# get the year for each series a round
series_a['year'] = series_a['announced_on'].apply(lambda x: x.split('-')[0])

# group by year and sum the raised_amount_usd
series_a_per_year = series_a.groupby('year')['raised_amount_usd'].sum()

# plot the data
plt.plot(series_a_per_year.index, series_a_per_year.values)

# set the title and labels
plt.title('Trend in Series A Dollars Over Last Five Years')
plt.xlabel('Year')
plt.ylabel('Raised Amount (USD)')

# show the plot
plt.show()

The error:

11:04:56 AM: AttributeError("'Timestamp' object has no attribute 'split'")
File "/python.py", line 40, in <module>
series_a['year'] = series_a['announced_on'].apply(lambda x: x.split('-')[0])
File "/basis/protocol-container/.venv/lib/python3.10/site-packages/pandas/core/series.py", line 4771, in apply
return SeriesApply(self, func, convert_dtype, args, kwargs).apply()
File "/basis/protocol-container/.venv/lib/python3.10/site-packages/pandas/core/apply.py", line 1105, in apply
return self.apply_standard()
File "/basis/protocol-container/.venv/lib/python3.10/site-packages/pandas/core/apply.py", line 1156, in apply_standard
mapped = lib.map_infer(
File "pandas/_libs/lib.pyx", line 2918, in pandas._libs.lib.map_infer
File "/python.py", line 40, in <lambda>
series_a['year'] = series_a['announced_on'].apply(lambda x: x.split('-')[0])

GPT got confused about the data type (str vs datetime). When we feed it the original code and the error and ask it to fix it though:

prompt = f"""

{result.python}

{result.error}

Above is the code and the error it produced. Here is the corrected code:

"""

It produces the corrected code:

# import the necessary libraries
import matplotlib.pyplot as plt
import pandas as pd

# Load the data into a pandas dataframe
records_df = get_data()

# subset to only series a rounds
series_a = records_df[funding_rounds['investment_type'] == 'series_a']

# get the year for each series a round
series_a['year'] = series_a['announced_on'].dt.year

# group by year and sum the raised_amount_usd
series_a_per_year = series_a.groupby('year')['raised_amount_usd'].sum()

# plot the data
plt.plot(series_a_per_year.index, series_a_per_year.values)

# set the title and labels
plt.title('Trend in Series A Dollars Over Last Five Years')
plt.xlabel('Year')
plt.ylabel('Raised Amount (USD)')

# show the plot
plt.show()

Raw SQL execution

In this upgraded bot we wanted to also give the user the ability to send back corrected SQL, since GPT often misses the mark by just a bit. This just required detecting a message as raw SQL and then making sure we extract only the SQL out of the message, which GPT is quite good at:

prompt = """Reproduce the SQL statement from the following, exactly as written:

{sql}

```sql
"""

Conclusions

ChartBot is fundamentally very broken -- it gets a lot of simpler questions wrong and most of the hard ones. The reality though is that it is still actually genuinely useful! More as a code assist technology than a true replacement. It saves a lot of effort -- looking up joins and columns, fiddling with sql, remembering charting syntax -- are all time conuming and painful. ChartBot does 50-90% of the work for you. The ability to send back corrected code fills the final gap and places you in the editor seat. I did not set out to build something actually useful at the start of this project, more of an experiment, but with a couple weeks of tinkering I’ve built something that, with a bit more work and polish, feels like it could change the way I work with data.

It would be dismissive to think that something like ChartBot couldn't also learn over time, like any human anlyst would, and get to the point where it is no longer just an assistive technology but a truly disruptive one. If you train it over a month or two on good and bad examples that it can build an embedding index against and include in its prompt (or use an existing corpus of queries your company probably already has), how much more accurate and reliable could it become? Is dialogue with an AI the future interface to all data? We will test some of these ideas in part III, stay tuned.

Calder White

My goal for this blog was originally to create a bot to follow crypto whales. It's a popular strategy due to the abundance of transparency in blockchain networks. Accounts like @whale_alert make it easy to follow this activity. However, crypto whales actually have many options available to them to sell their crypto long before they move their coins on-exchange such as crypto derivatives on Binance.

I recently read an article in favor of the whale watching arbitrage. While there may be some cherry picked cases where it indicates volatility, an important property of a crypto trading bot is a large sample size of data and frankly crypto whale movements are fairly sparse.

Depending on your definition of a whale there is either an abundance of whale transactions, so many so in fact that there is no correlation. Or, there are so few that we only have 2 events in history where we can really observe the effect of whales

Collecting Whale Data

I ended up needed to take a couple of approaches until I was finally able to scrape whale data from the internet/blockchain.

Attempt #1: Webscraping Whale Alert

My first instinct was to use the Whale Alert. However their service is paid so I looked to the twitter account which is free.

Whale alert has an inconsistent tweet format, but the core information of their whale alert tweets are consistent enough to make a regex for. Essentially it goes

[comma seperated number] #[numbers & upper case letters] ( [comma seperated number] USD ) [any text]

[link to whale alert]

For this formula I just used one space to denote whitespace, but it could be any amount of whitespace so for the regex I will match ≥ 1 whitespace characters instead of just a space

I decided to use webscraper.io to scrape them instead. In about 10 minutes I had it automated and scraping their twitter page.

… but twitter capped me once I went back to December 5th ☹️

It turns out webscraper.io is slower than manually just scrolling through their twitter feed because for some reason webscraper.io scrolls back to the top every time it tries to scroll to the next “page” in twitter’s infinite scrolling.

Attempt #2: BlockSci

Using BlockSci to query to the block chain, and then requesting from whale alert’s website based on large transaction hashes to attach whale alert’s metadata to the transaction. We can request https://whale-alert.io/transaction/ethereum/[txn hash] and it will tell us metadata about where the transaction is from and where it is to. We care if the transaction is to an exchange, like coinbase or binance. For this specific example we are also not concerned if the transaction is between two unknown addresses.

However, a cloud provider would likely need to be used due to the enormous RAM, disk and compute required to run BlockSci since it is no longer publicly hosted. Additionally, whale alert’s public history does not go back very far in history.

Attempt #3: AWS Athena Queries (🏅winner!)

It turned out that AWS has some open data on this. I followed this guide and used AWS Athena to query the BTC & Ethereum transactions for large transactions

Note!! Later we will reduce the number of columns we are querying to only the ones we need instead of * . This will save an enourmous amount of time and cloud computing costs, so I recommend not running the follow select * queries just yet. Hold on until we reach the more refined queries 🙂.

Here are some queries I used for finding large (whale) transactions:

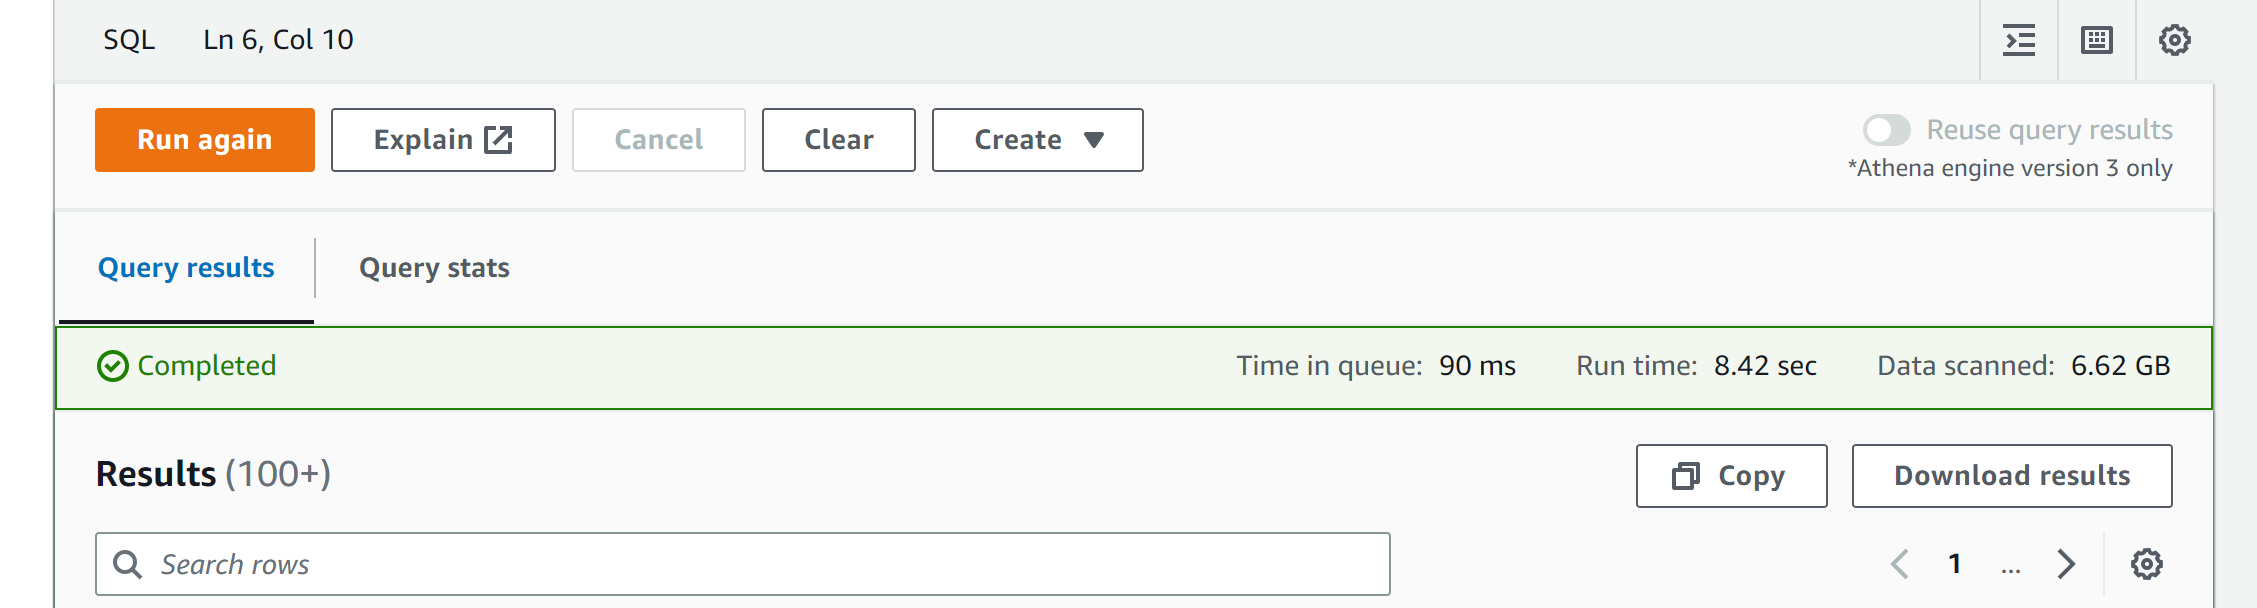
Filtering for large BTC transactions (queried 340GB):

select
*
from btc.transactions
where
block_timestamp > from_iso8601_timestamp('2019-01-01T00:00:00.0Z')
and value > 5882.35294

(≥ 5882 BTC because at current market price that would be a move of ≥$100M USD)

Filtering for large ETH transactions (queried 77GB in 12.6s) :

select
*
from eth.transactions
where
block_timestamp > from_iso8601_timestamp('2019-01-01T00:00:00.0Z')
and (value/10000000000) > 7246376810000

(units for value in AWS’s transactions records are wei. 72463768100000000000000 wei = 72463.7681 ETH ≈ $100M USD at market price today)

Analysis of the query results

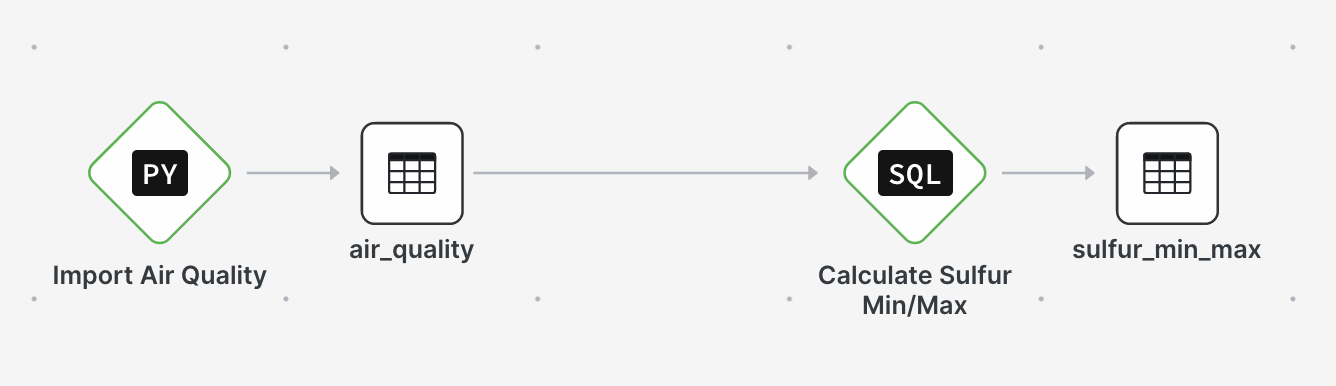
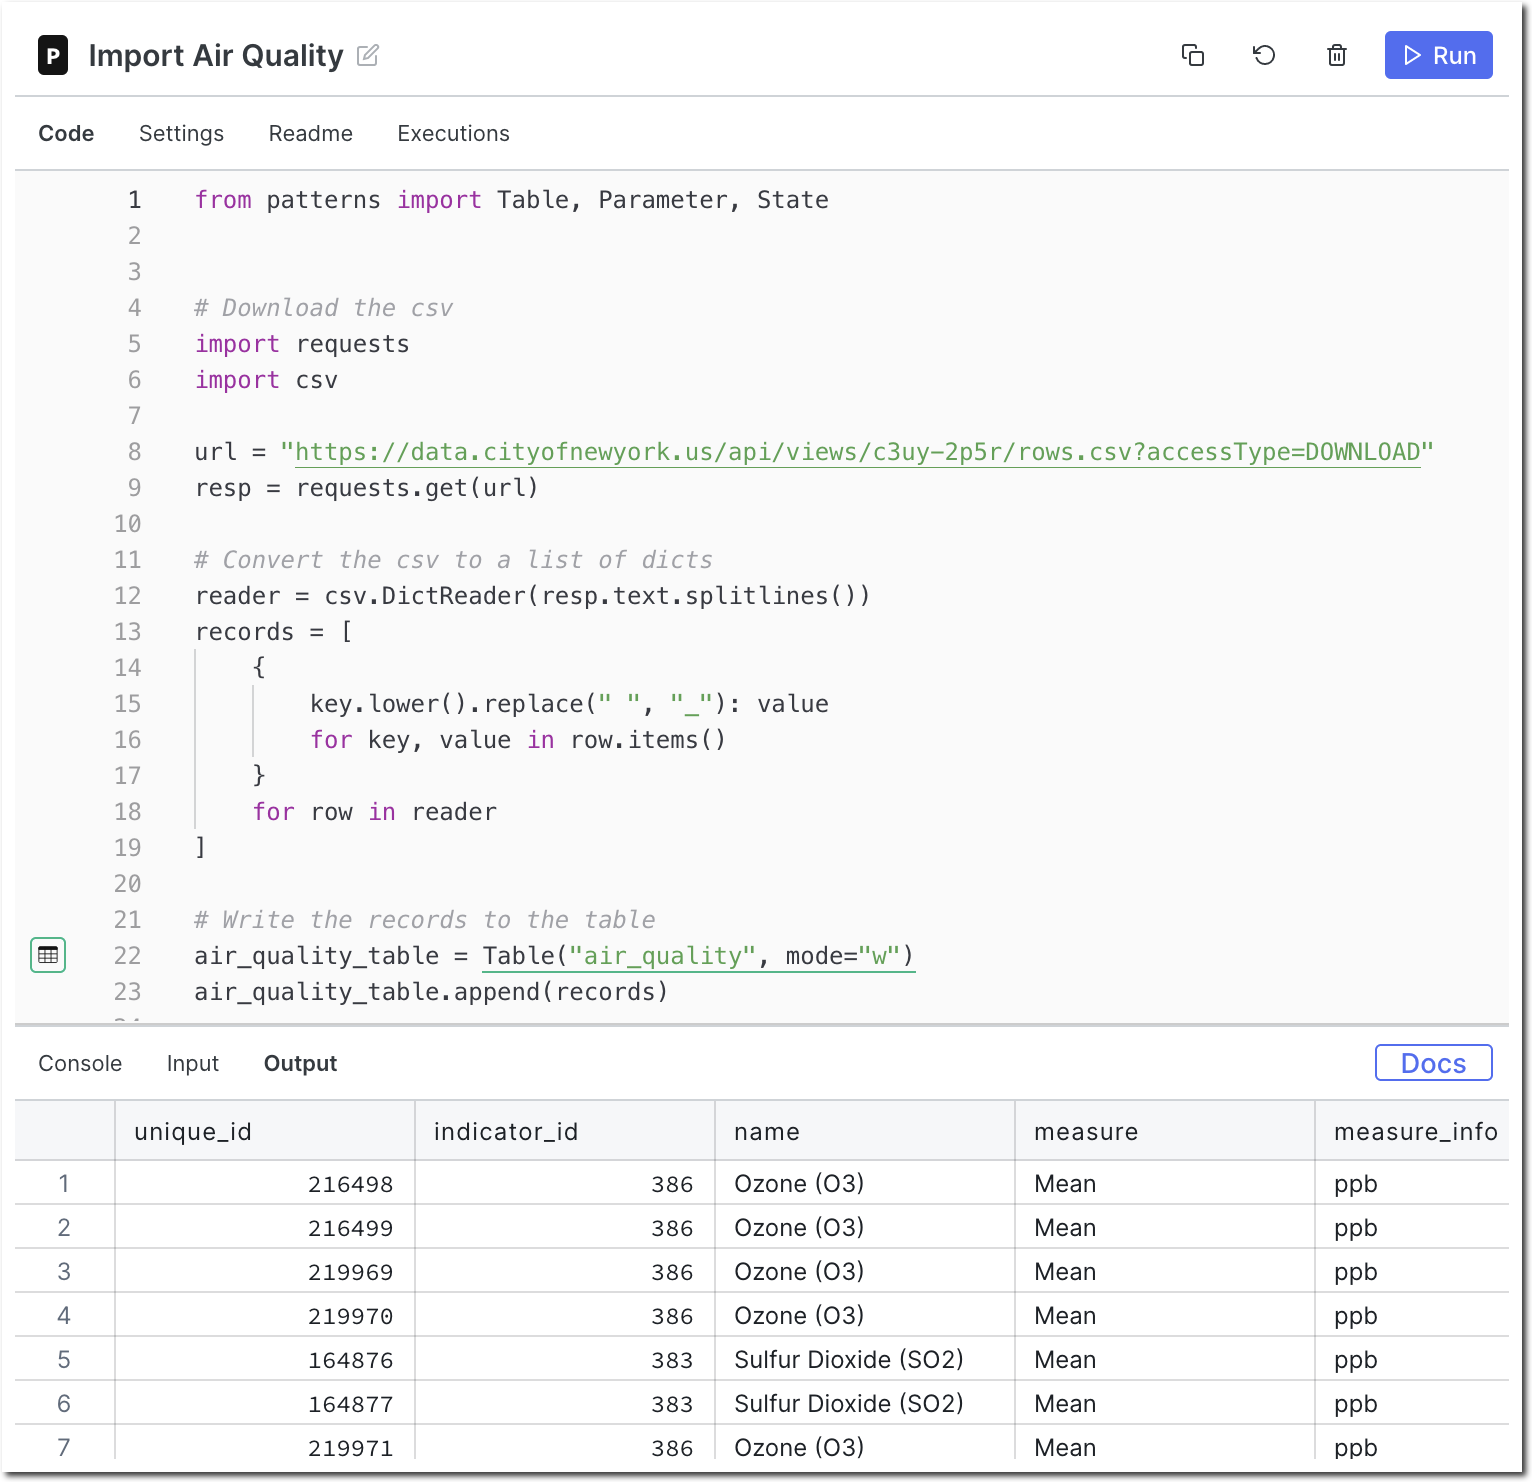
AWS Athena stores your query results in AWS S3, so you can use a patterns component to import the CSV directly into Patterns! I also wrote a python node to automate downloading Binance’s daily, 5 minute and 1 minute data and import it to a patterns table.

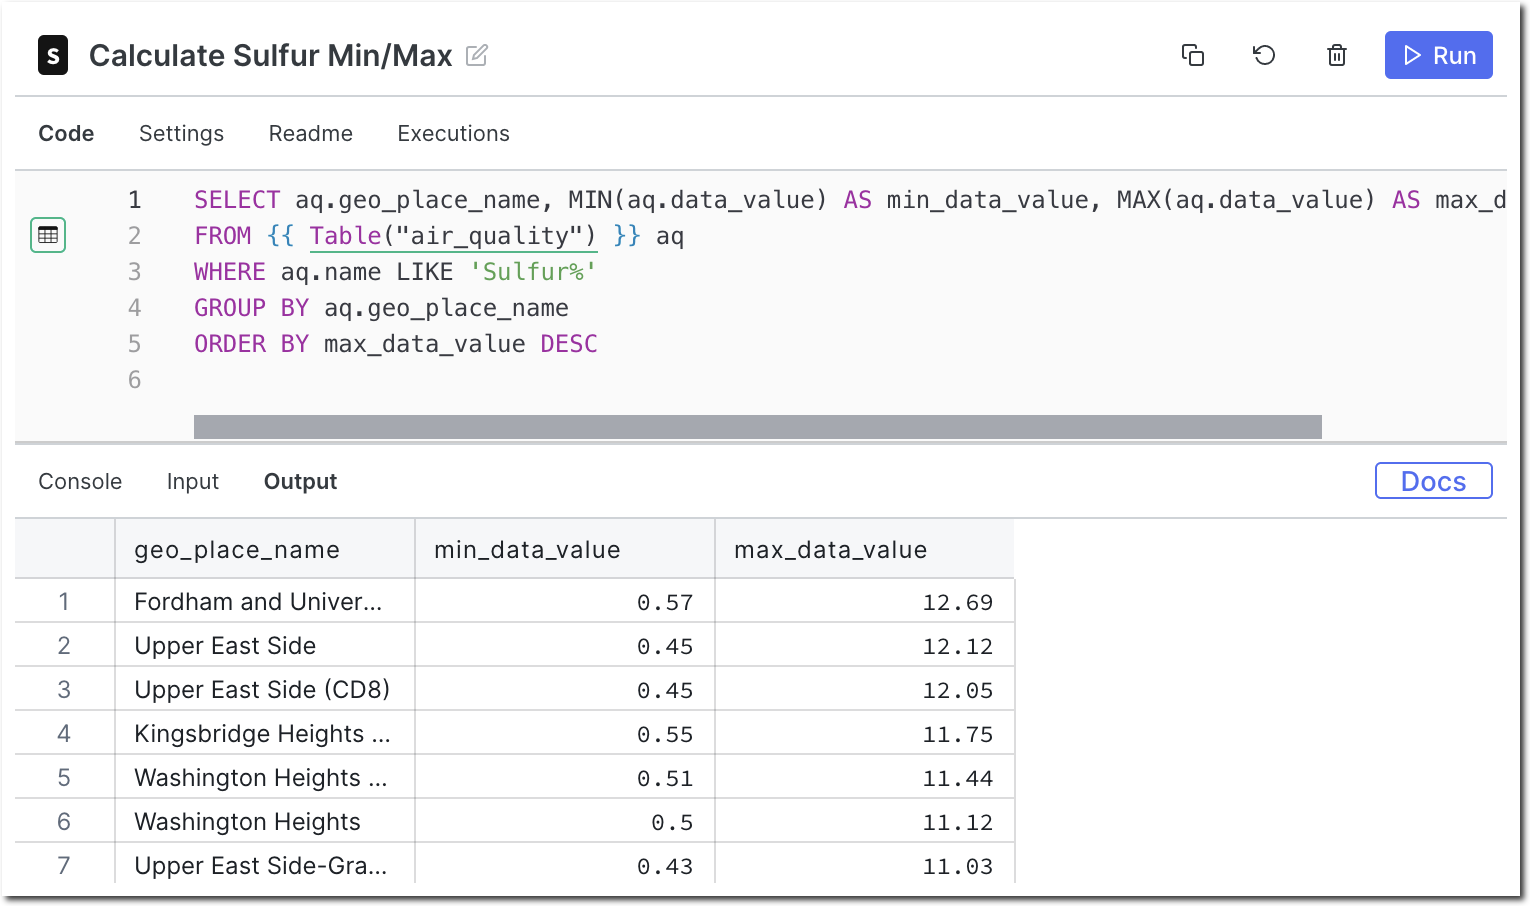
I joined the whale transactions with the BTC Prices using a patterns SQL node. I fiddled with the threshold for a whale transaction by adjusting the minimum number of bitcoins required. 10k BTC was too low and happened practically every day for the last 3 years, 20k was high enough to begin seeing some interesting patterns. Observe:

Untitled

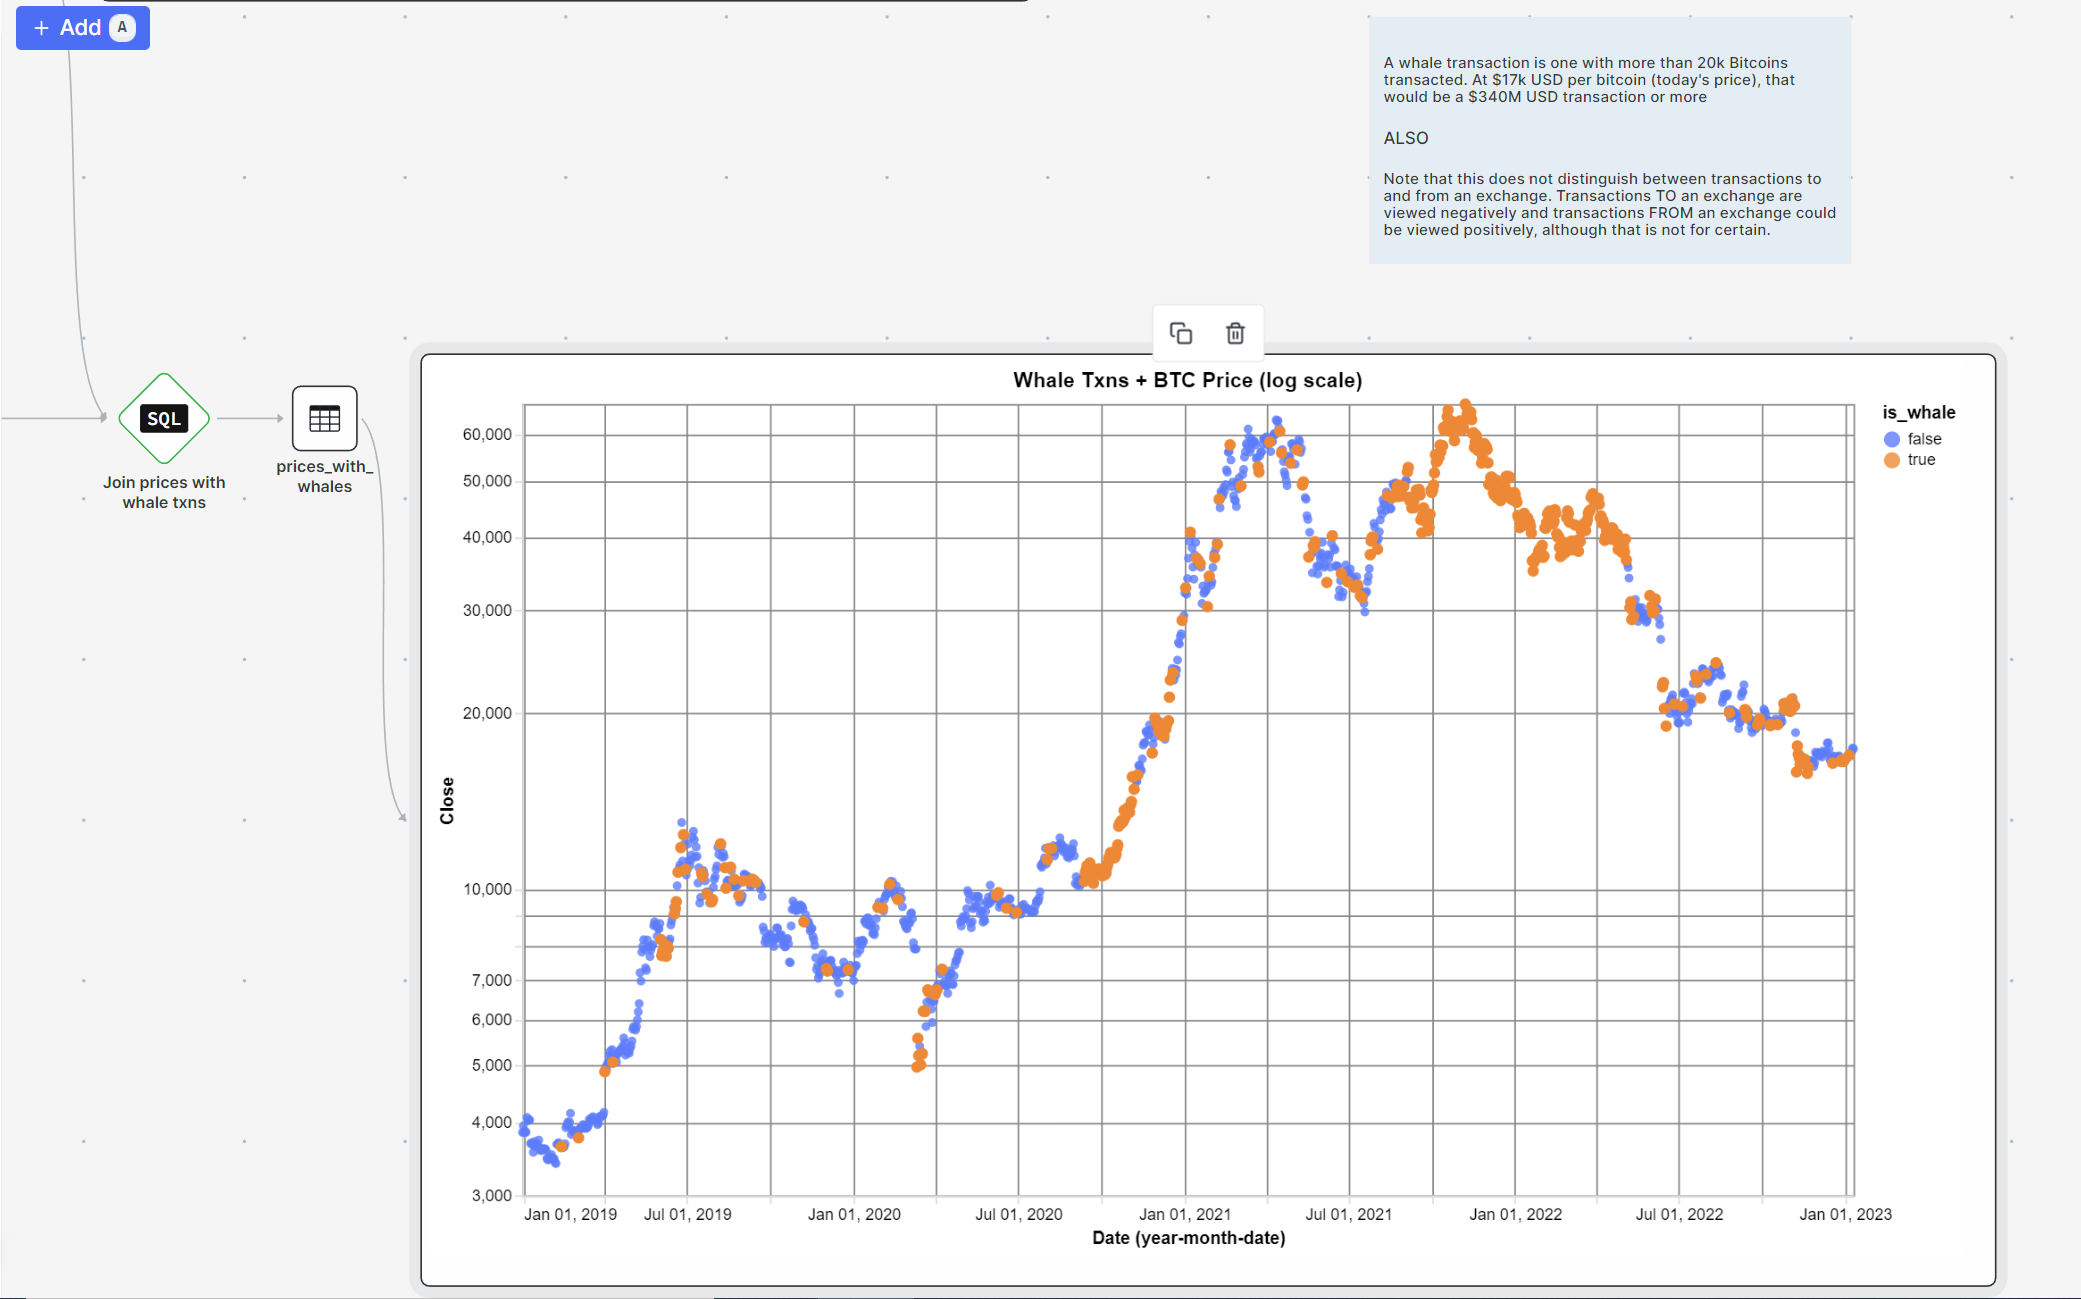
Of course we are eyeballing this, but on a macro scale (over a relatively small period of 3 years mind you) it appears that there is some correlation between weeks/months of back to back whale transactions and market volatility, both in the up and down direction.

What could be even more interesting is tracking the direction of these transactions. For example, whether or not they are to/from an exchange. If $1B USD in BTC is sent to coinbase, that might not be such a good sign and may provide more signal compared to 2 whales exchange $1B BTC, or exchanging a smaller amount like $300M BTC. But for a quick litmus test to see if this data is potentially actionable, this chart provided fast insight and inspired me to keep digging.

out.PNG

Going Deeper: Looking into the Network’s daily volume

select
sum(input_value) as network_volume,
date(block_timestamp) as date
from btc.transactions
group by
date(block_timestamp)

Untitled

Note: By reducing the number of columns in my output query, Athena scanned far less data thus decreasing my bill 56x !!! This is really cool.

Here is the new query I used to get the whale transactions since inception:

select
count(1) as count,
sum(input_value) as total_whale_volume,
date(block_timestamp) as date
from btc.transactions
where
input_value > 20000
group by
date(block_timestamp)

Untitled

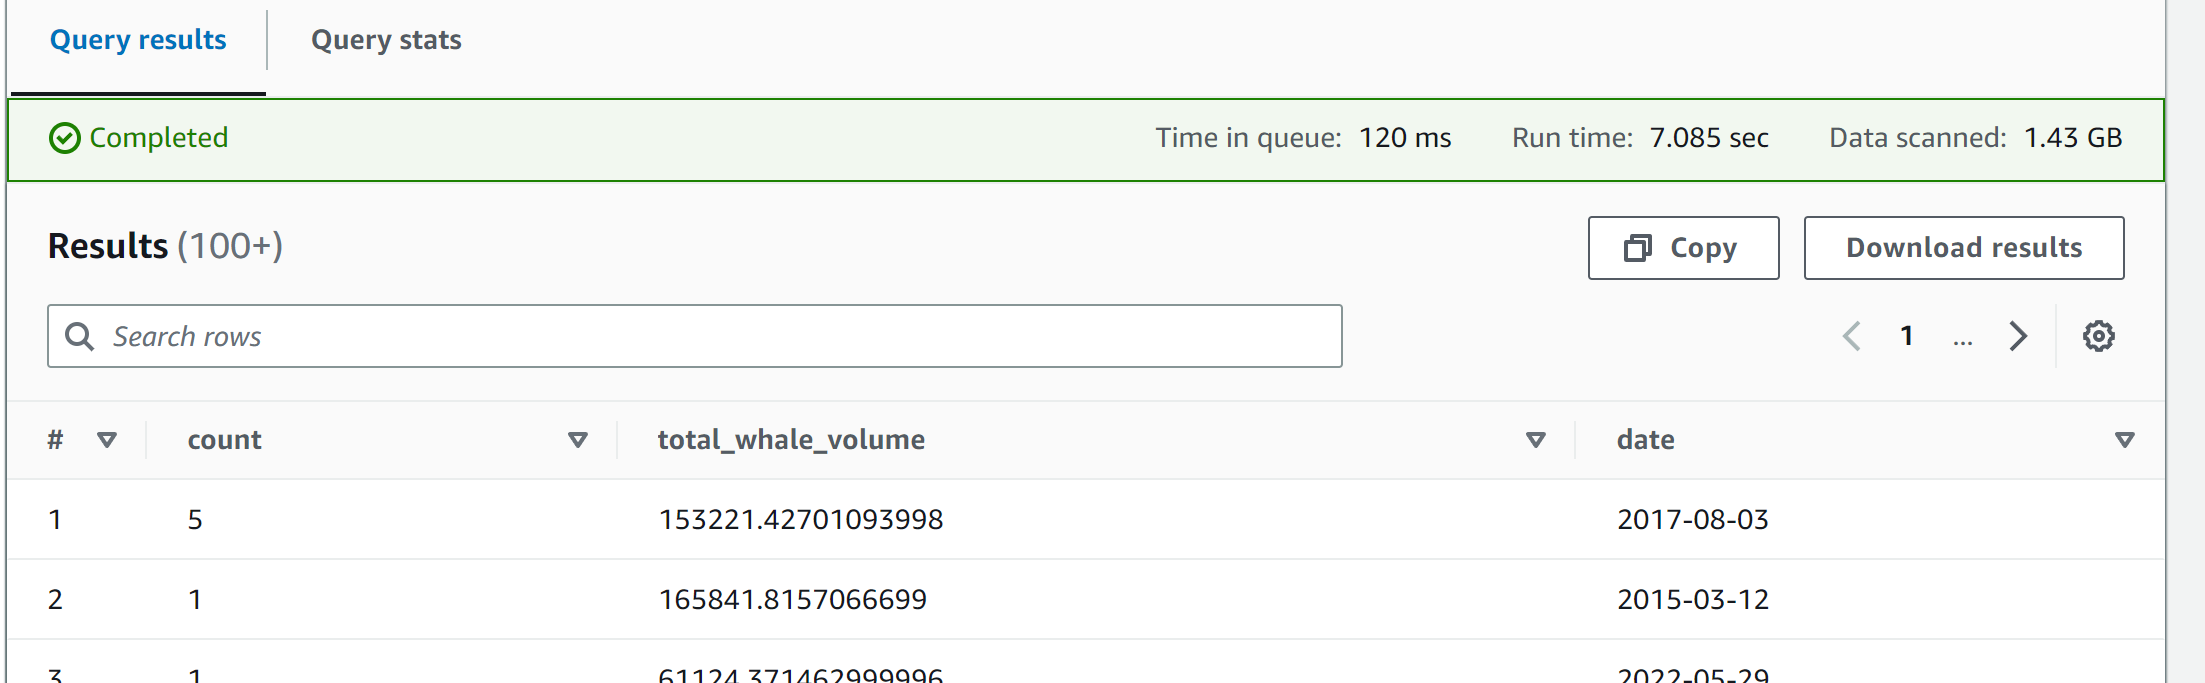
^much cheaper with selective fields 🤩

Now my join looks a little different. Instead of doing the aggregations and filtering downstream, we did the aggregations upstream. However, we can still do some filtering on the BTC whale transactions. See next:

with whale_timestamps as (
select
count,
date
from {{ Table("all_time_big_whales") }}
where
count > 10
)

select
btc_prices."Date",
btc_prices."Close",
case
when whale_timestamps.count > 0 then true
else false
end as is_whale
from {{ Table("longer_btc_prices") }} as btc_prices
left join whale_timestamps
on btc_prices."Date" = whale_timestamps.date

I can observe the number of whale transactions along with the total value of those transactions. I believe this will be a better heuristic for the market movements and volatility we are trying to predict.

Untitled

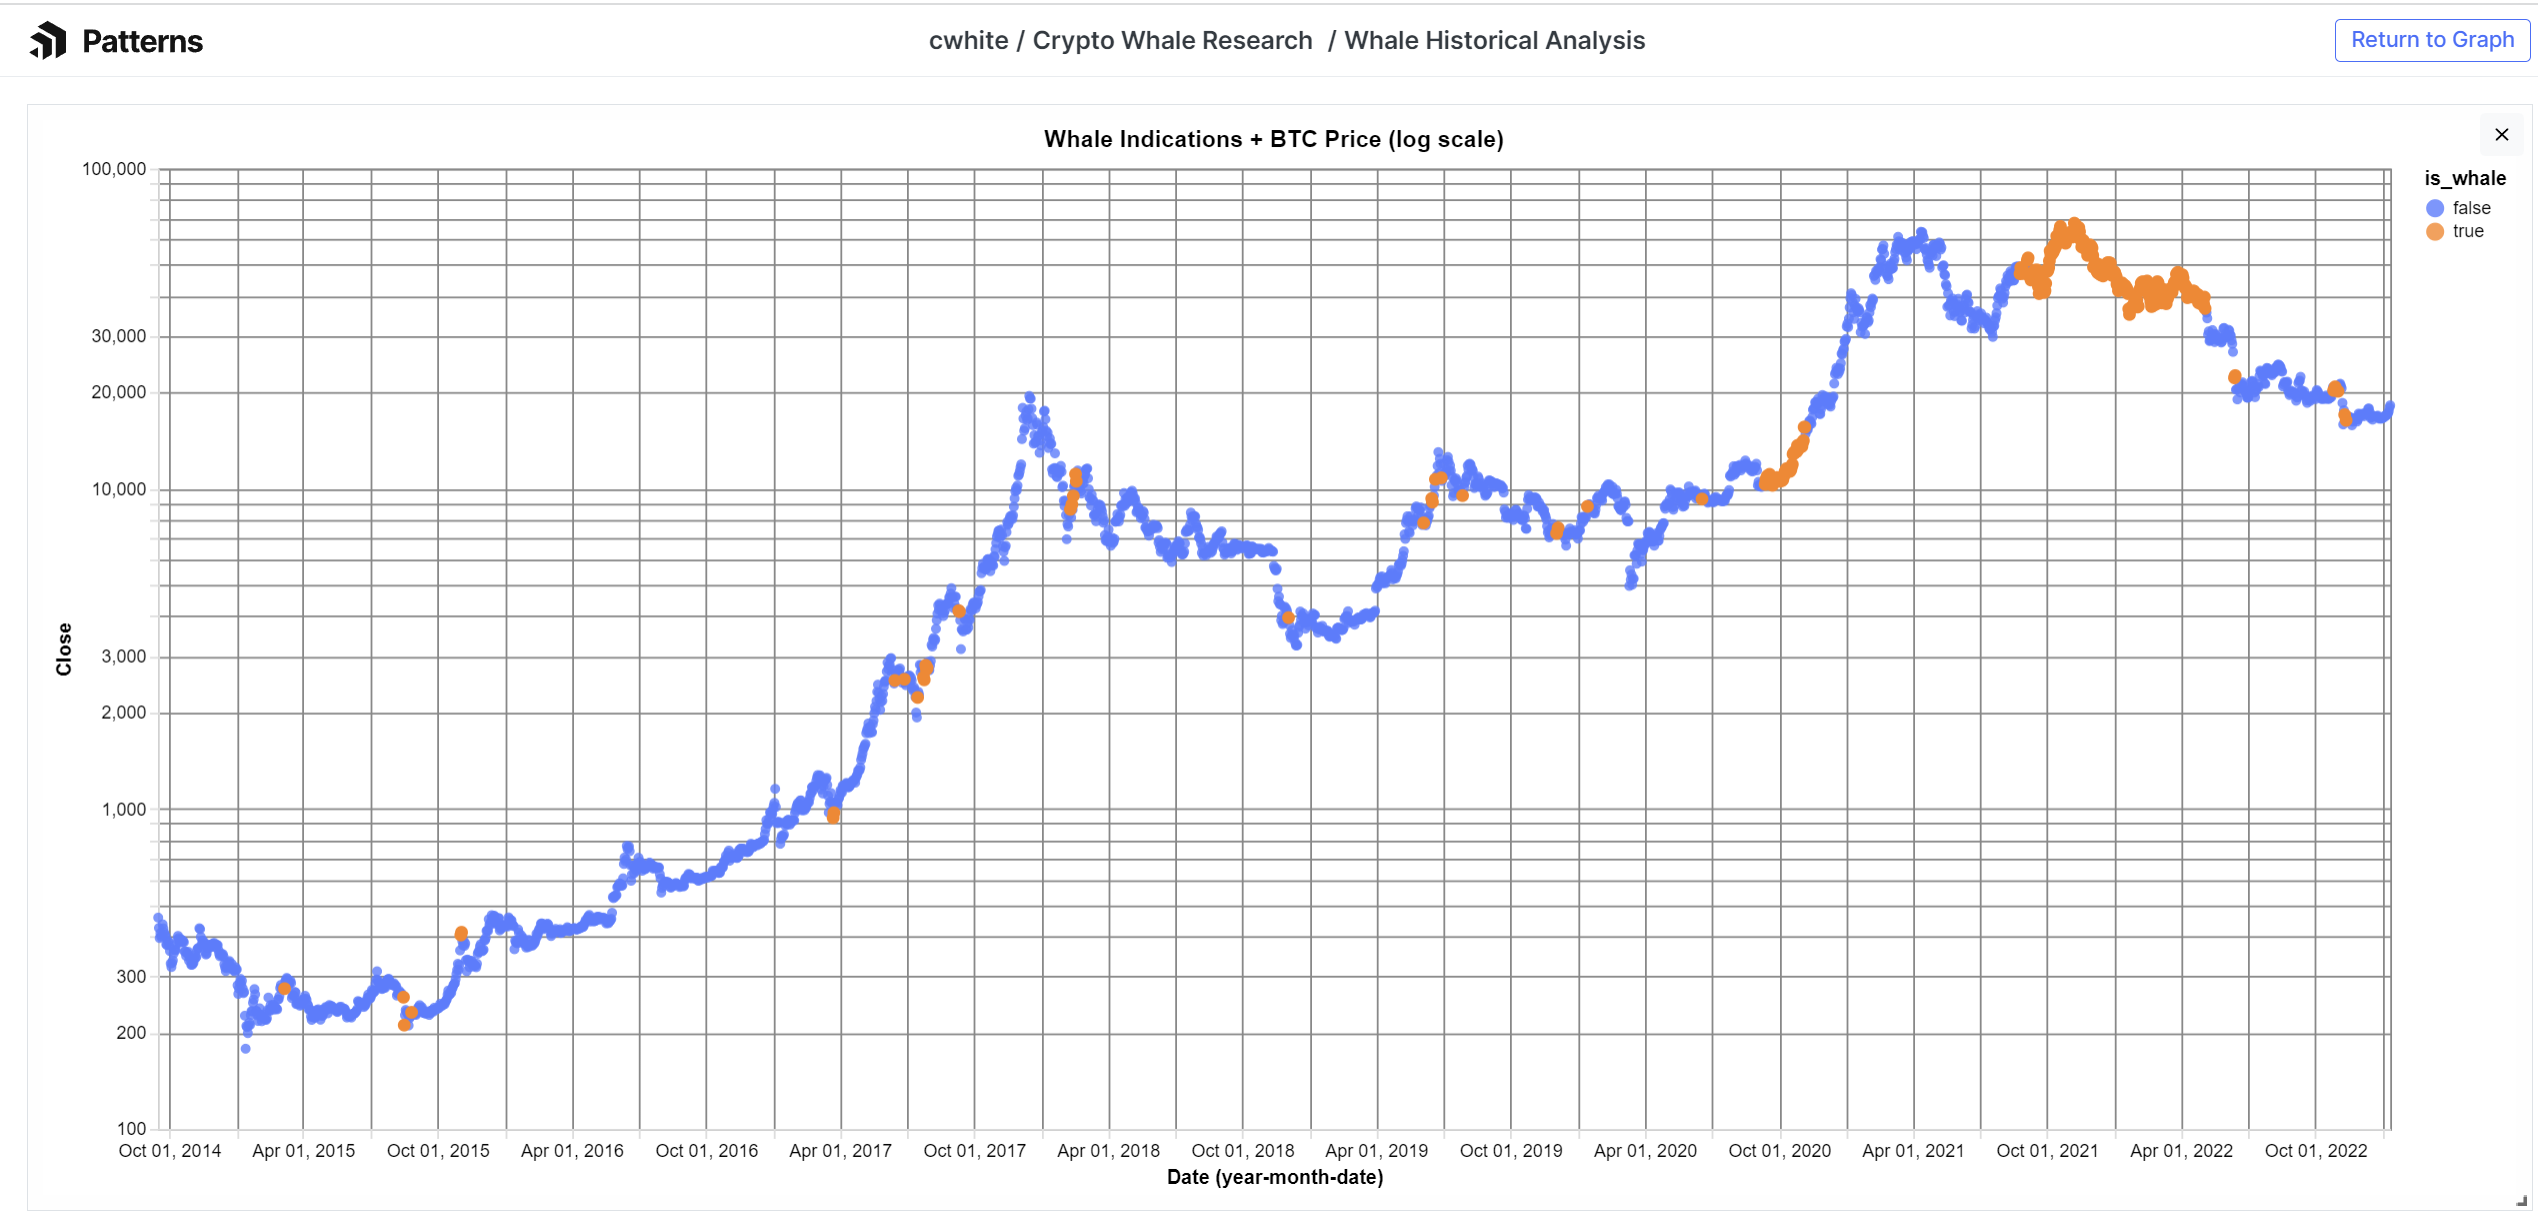
Each orange dot represents a day when more than 10 BTC transactions occurred with values exceeding 20k BTC, roughly equating to $340M USD

Conclusions from Whale Transactions

While this chart may look interesting and seem to predict some market volatility, the price of BTC is always volatile so what we should look for is correlation over a large sample size. Here is that sample:

Screenshot 2023-01-30 at 3.38.07 PM.png

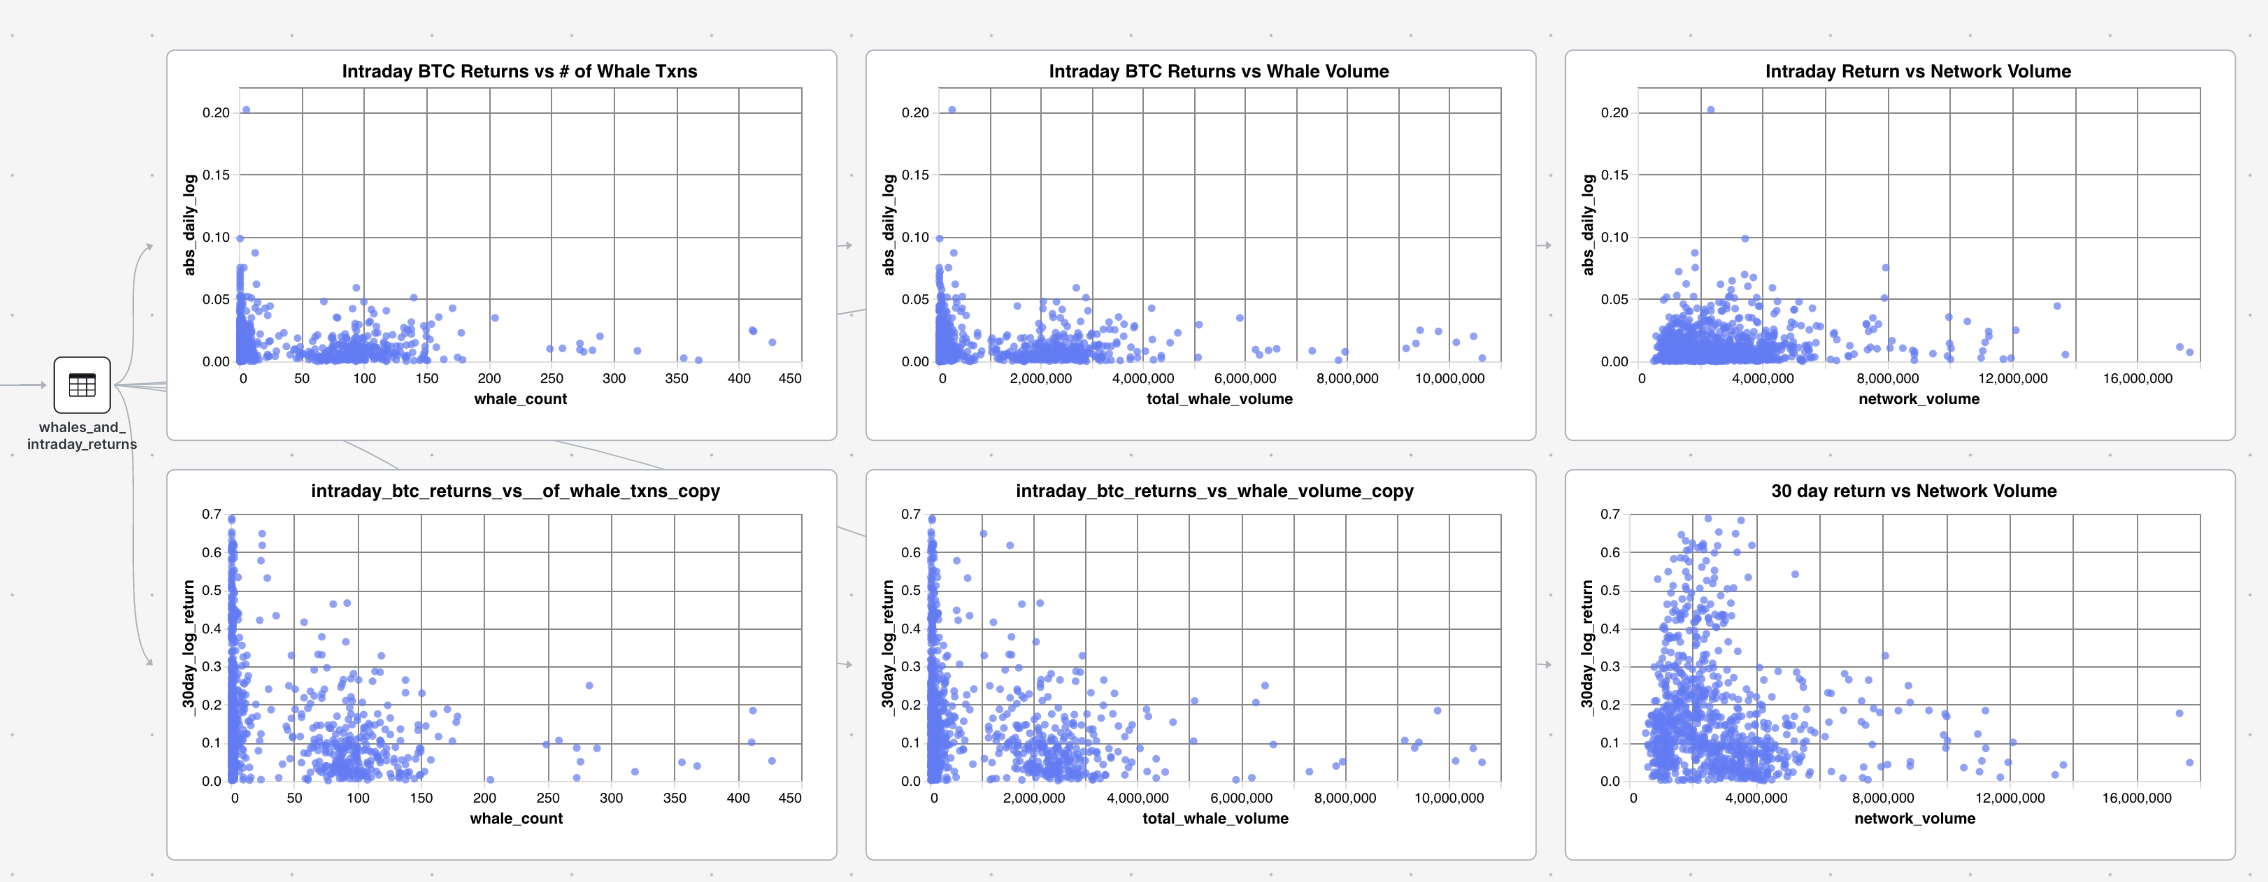
Observing both whale transactions and network volume as predictors of volatility over 1 day and 30 days, we can see that there is absolutely no correlation going on here. It is more or less random

New Idea: Micro Predictions

Going on the theme of whales, let’s dig into the idea of information and delay of information in the network. Specifically on the time between blocks. Perhaps traders/trading bots cover themselves as soon as a whale transaction occurs. They could even be looking at the block that is currently being mined to front run this strategy. Maybe we want to trade based on the block that is currently being mined since the network is essentially in a stand still until the next block is found and that chunk of transactions is processed.

For this I took the block data and queried for the time between them. Then I joined that data on the price data for the time the block is found

Screenshot 2023-01-30 at 4.46.16 PM.png

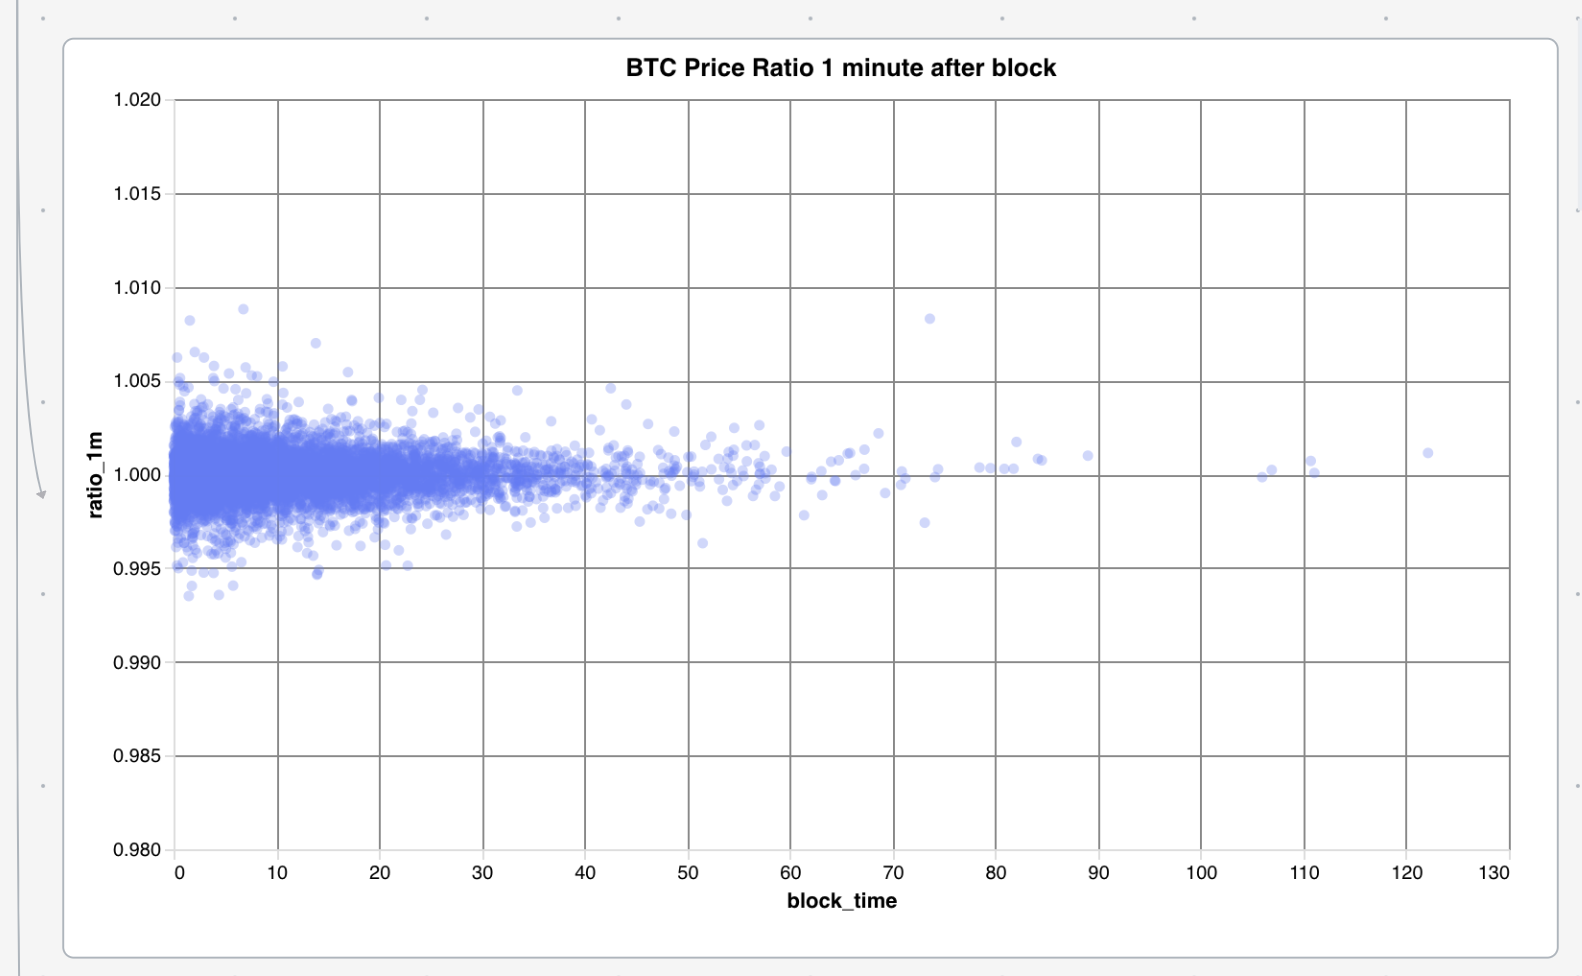
There is not a particular trend that the spread of the returns narrows as the block time increases. However, we have less data for long block times, so it could just be that we don't have enough data and that is why the distribution appears to narrow with longer block times.

Screenshot 2023-01-30 at 4.51.25 PM.png

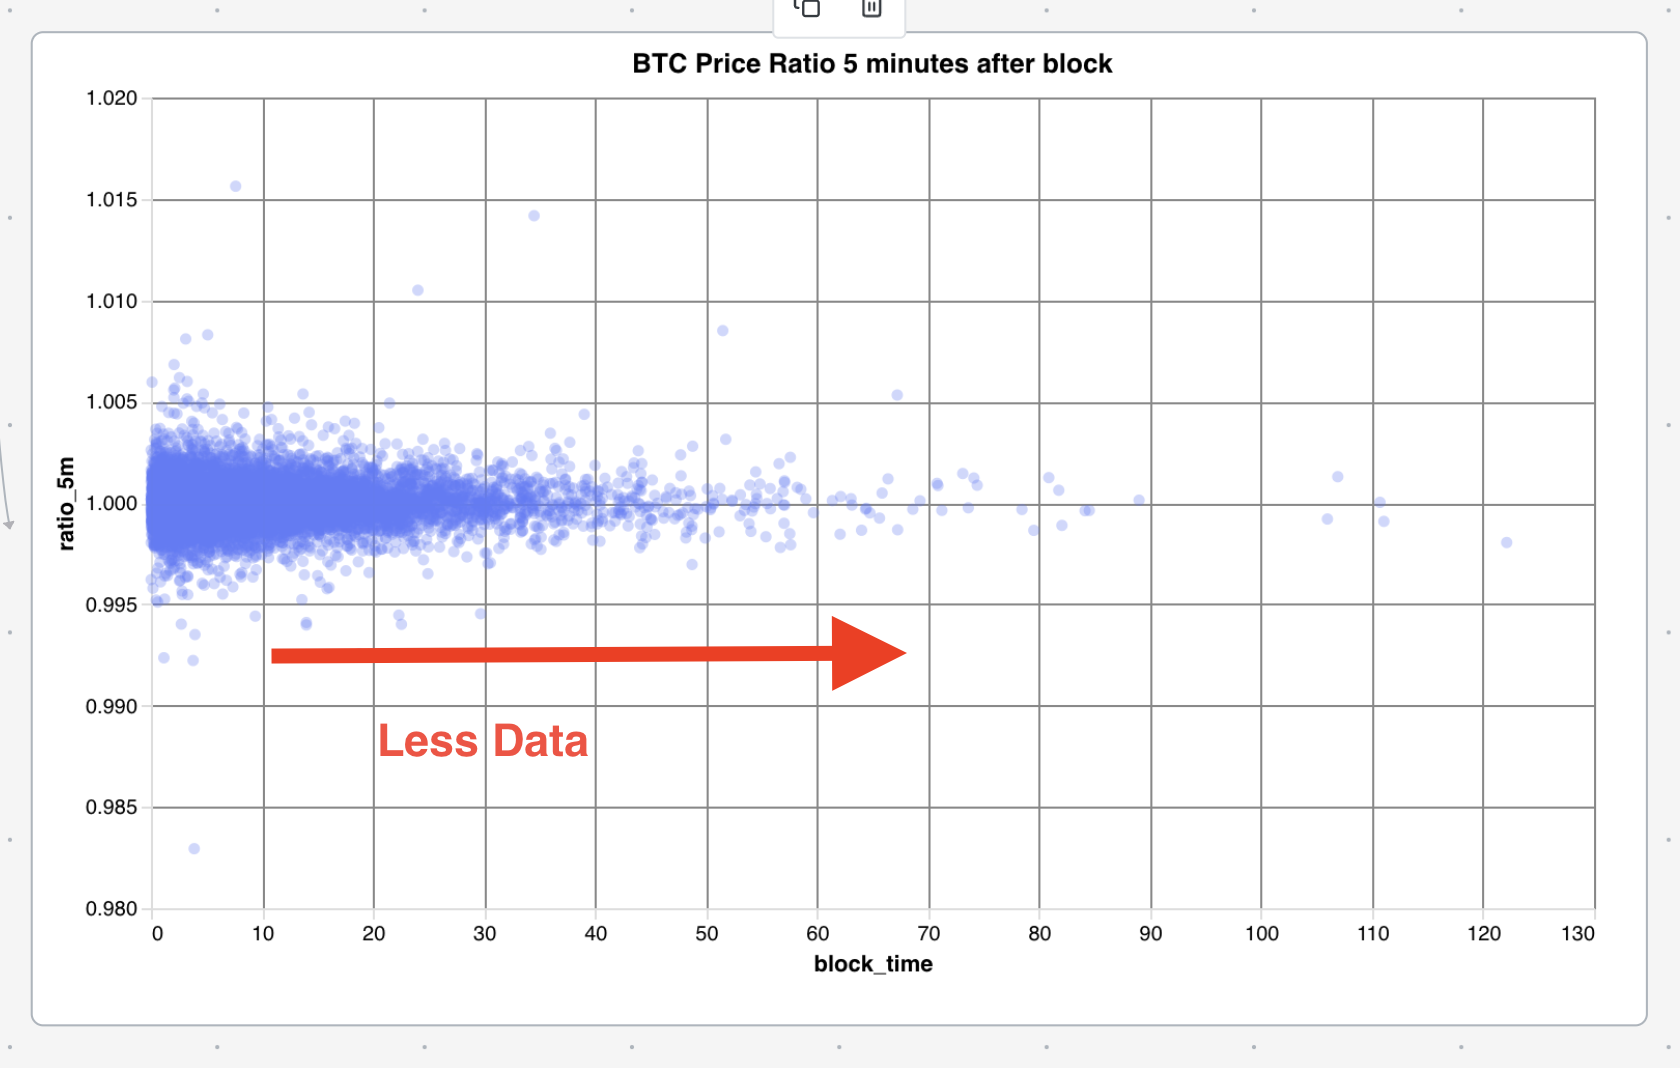
Although there is less data towards the tail we will continue the analysis to try and observe if there is a strategy that can be formed here.

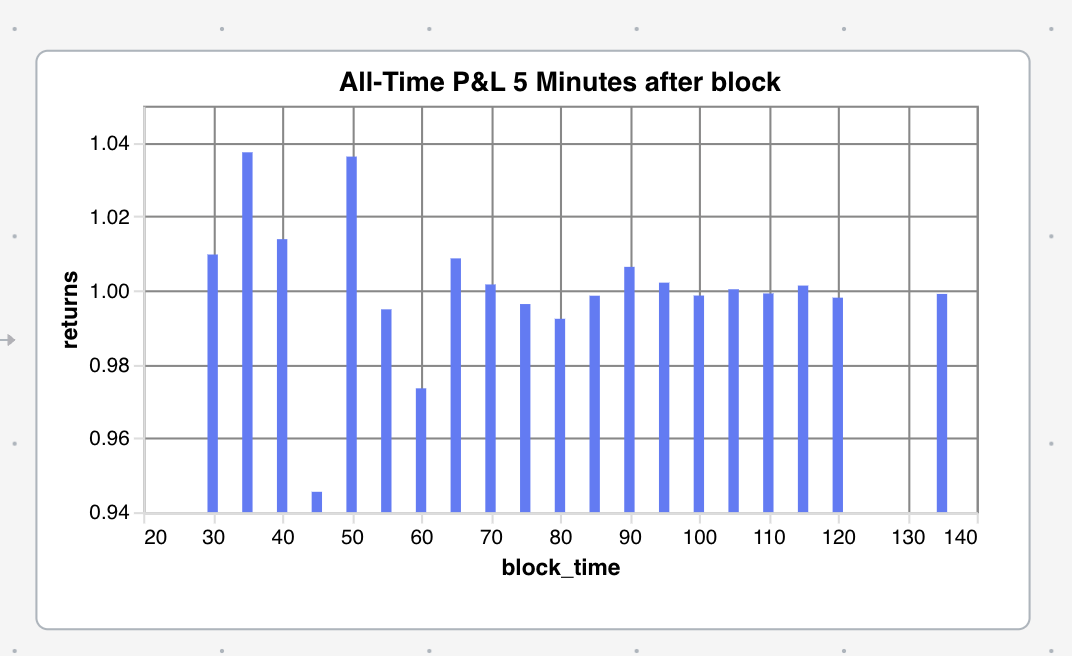
Below is the result of multiplying the ratios partitioned by the block time (grouped in 5 minute intervals). This essentially is telling us what the return is of buying immediately after a block_time of [n] minutes and selling after 5 minutes is over the last 3 years. Since most of the block times are short it makes sense that the returns are negative since the crypto market has overall lost money over the last 3 years. However, what is interesting is the calming ratio as the block times increase. This is in line with the data presented above which shows a narrowing ratio spread as block time increases. This more or less insinuates that the risk premium for long block times should be cheaper. As to why this is, confuses me slightly. My take is that the network is calmer during long block times since there is not an abundance of information being added to the blockchain whereas when the processing times are faster there is more information throughput in the network which creates volatility.

Screenshot 2023-01-30 at 4.47.01 PM.png

From this I gather that there is potential for an Iron Butterfly options strategy to profit off low volatility. For those unfamiliar, you are essentially selling a combination of 4 contracts that act as insurance against price movement. If not much happens to the price before your expiry you will make money. Here’s a P&L chart for the Iron Butterfly:

Untitled

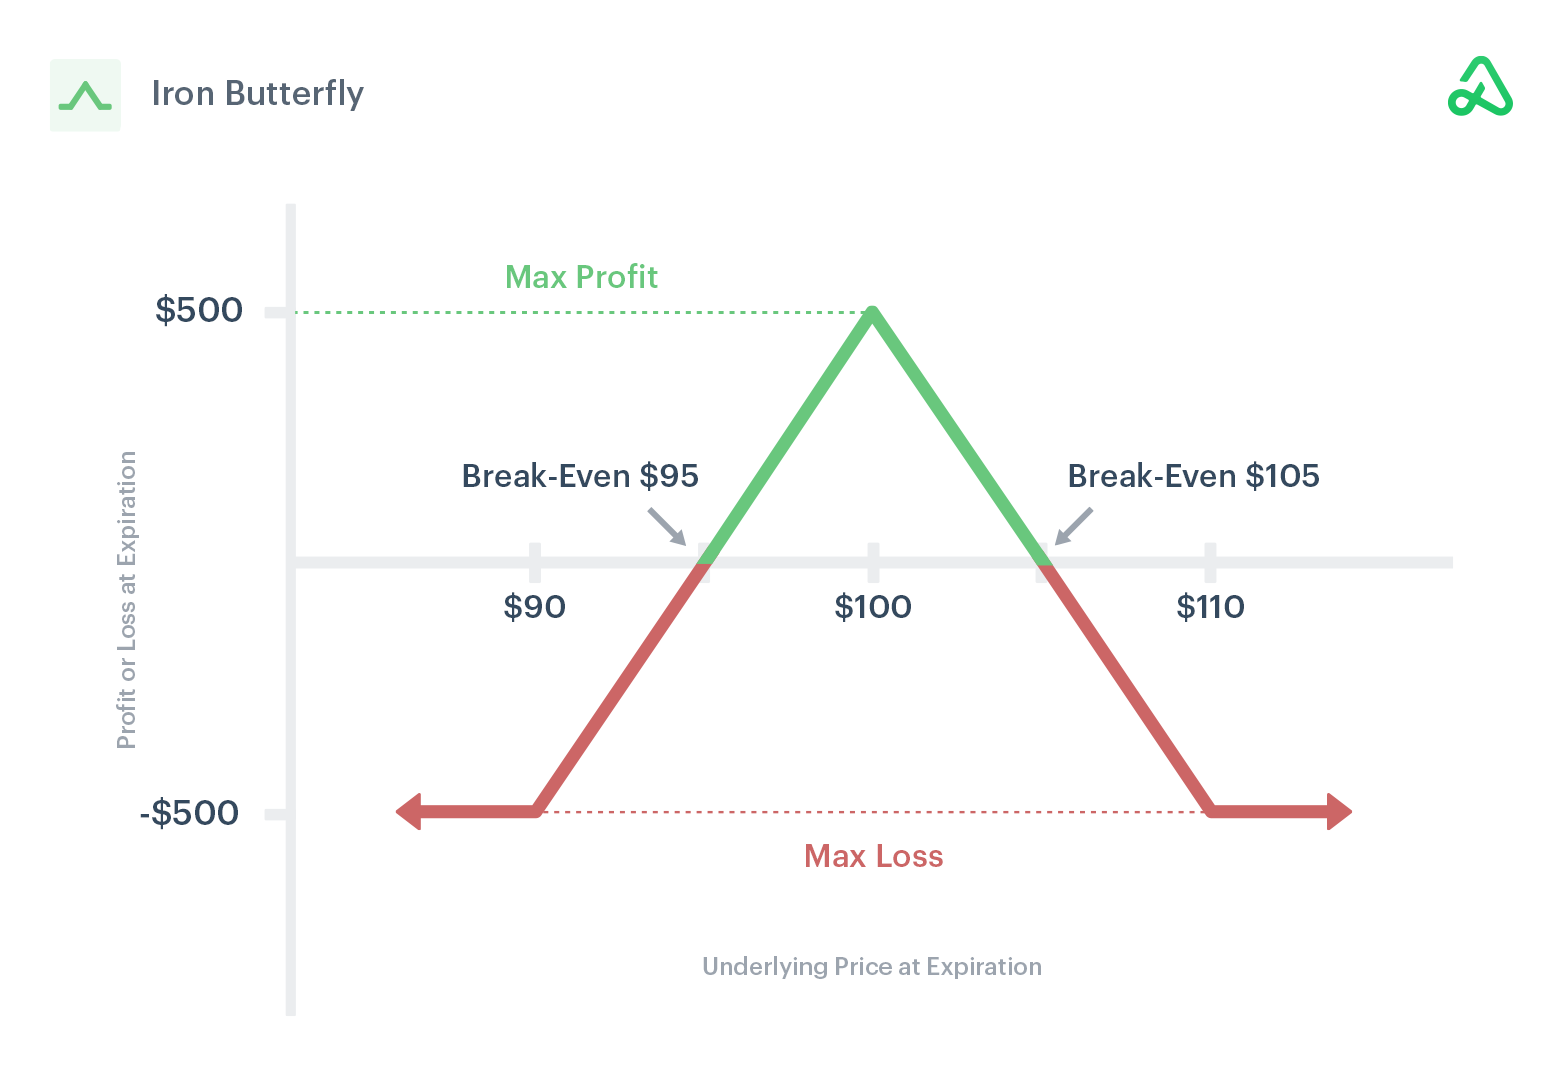
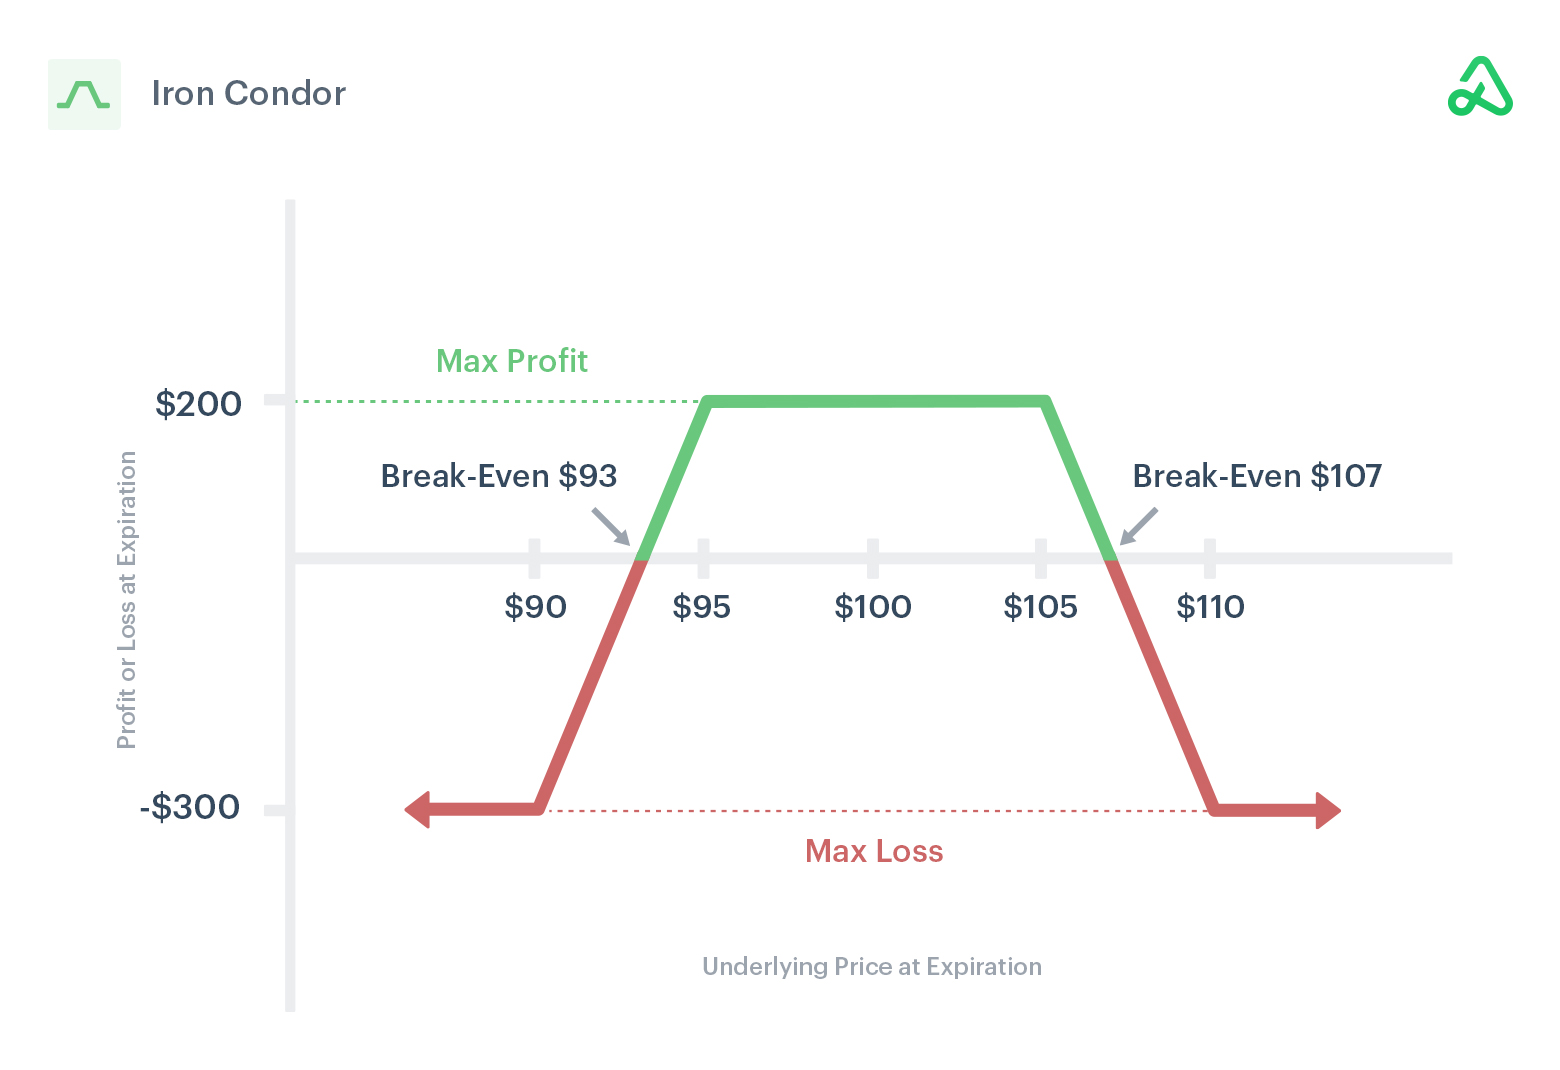
This is also similar to an Iron Condor except we are expecting the price to move so little that it should not be necessary for us to set such a high spread on our price so that we can limit our sunk cost per trade signal.

Untitled

Implementing the Bot

To implement the bot I used blockchain.info’s API. I polled the durations between blocks every hour and detect when a block is taking more than an hour to trigger a sell for the iron butterfly.

Code from this Blog!

The research for this blog was done with a combination of AWS Athena and Patterns. It can be seen here: https://studio.patterns.app/graph/cw3mbtihqf53fwmwrxzj/crypto-whale-research

The trading bot was also implemented as a Patterns graph and can be viewed here: https://studio.patterns.app/graph/2ounivt9fir1dz8ydyxr/whale-trading-bot

Jon Travis

slack interaction

Slack is a great tool for collaboration, but it can be hard to keep up with all the conversations. Wouldn't it be great to have someone summarize the channel for you, giving you highlights and answering questions about the details?

In this guide, we will explore building a Slackbot that uses OpenAI's GPT-3 to summarize Slack channels. To quickly build and deploy the bot we'll use Patterns, which provides storage, webhook listeners, serverless execution, Slack & OpenAI integrations, and an execution scheduler.

The purpose of this guide is to give a broad overview of what is required to build the bot.

Source: For detailed source, see: Slack Summarizer on Github

Try it: To use the bot in your own Slack workspace, you can clone it here: Slack Summarizer in Patterns

Slack Summarizer graph

Interaction design

Here's how our bot should work:

  • Mention: A user @mentions the bot, asking it to summarize a #channel
  • Quick Reply: The bot immediately replies, creating a Slack thread to interact with the user
  • Fetch Messages: The bot makes requests to Slack to get the relevant channel history
  • Prompt Creation: The bot constructs a prompt using the channel messages and sends it to OpenAI's GPT-3 model
  • Reply to User: The response from OpenAI is sent back to the user in Slack
  • Summary Interaction: The user may continue to @mention the bot in the thread, asking for more details.

Prompt Design

Prompts are the API of GPT-3, and the community is still exploring the best ways to create them to get the best results. Our considerations for this guide are:

  • Length: the text-davinci-003 model has a limit of 4000 tokens per request. This limits the number of messages we can include in the prompt.
  • Structure: messages are ordered chronologically, and each message may have a list of replies.

Considering length, we will take the simplest approach: only query the last X hours of messages. This is inadequate for a real application, but it serves our purposes here. There are a variety of techniques to summarize large quantities of text, such as using embeddings to search for related information, chunking, etc. There isn't a currently a one-size-fits-all approach, but it's a very active area of research.

Considering structure and length together, we will make a minimal JSON representation of the messages; saving on our token budget, but preserving the structure. Note that our JSON does not have any time related information for a message. In our experience, the bot doesn't need it to be generally useful.

The pretty version of the below JSON is 155 tokens, while the compacted version is 59 tokens. It pays to be compact!

[
{
"u": "Marty McFly",
"t": "Hey Doc, I need your help with something",
"r": [
{
"u": "Doc Brown",
"t": "Sure Marty, what's up?"
},
{
"u": "Marty McFly",
"t": "I need to go back in time to 1955"
}
]
}
]

Channel Summarizing Prompt

We wrap the messages with processing instructions. When summarizing, the prompt looks like this:

Here are a list of messages in JSON format.

{the JSON messages}

Please summarize the messages and respond with bullets in markdown format.

Summary Interactive Prompt

When the user asks for more details about a summary, we supply the same messages but allow the user's query to be included directly in the prompt:

Here are a list of messages in JSON format.

{the JSON messages}

Please respond to this question in markdown format: {the user's question}

Working with the channel history

When a user @mentions the bot, we need to get the channel history. To do this, we simply ask Slack for the recent messages and threads within the channel. This can result in many API calls, each taking some time. To make this faster, we have two options:

  1. Store all Slack messages in a Patterns table and query against it. This would result in the fastest response time, but would require a lot of storage for things that might not ever be queried.
  2. Query Slack on demand but cache the results in a 'session', allowing the bot to reuse the messages for multiple interactions.

For this guide, we adopt the second approach. When a conversation is initiated with the bot, the messages are fetched from Slack and stored in a session. The session is then used for all subsequent interactions.

Session block slice

Replacing user IDs in Slack messages

Messages from the Slack API contain user IDs instead of user names. This allows users to change their names and still show up correctly in message history. The raw messages look like this:

{
'text': 'What do you think, <@U04F2AMBJ14>?',
'ts': '1673985851.921529',
...
}

We need to replace these IDs with the names of the user. Fortunately, we can simply ask Slack for a list of users in the workspace and use this mapping to replace the IDs in each message. This is a simple operation, but we don't want to do it every time the bot needs to make a summary; each API call will slow it down. The list of Slack users in a workspace doesn't change very often, so it's a perfect candidate for caching.

Caching user IDs every day

Patterns has two capabilities which help us quickly solve this problem:

  • Built-in storage, which gives us a place to put the cache
  • A scheduler, which can run our code periodically

We create a Python node called Import Slack Users which gets the list of users from Slack and puts it into a table called users. We schedule it to run once a day at 2am UTC by giving it the cron expression 0 2 * * *.

Now we have a users table which the rest of our bot can use to map user IDs to names.

The code to do this roughly looks like:

user_table = Table("users", mode="w")
user_table.init(unique_on="id")

users_list = slack.users_list()
user_table.upsert(users_list.get("members", []))

Interacting with OpenAI and Slack

The APIs for interacting with Slack and OpenAI are well-documented and easy to use. The final piece of the bot is to issue the query to OpenAI and send the response back to the user in Slack. This implemented in this section of the graph:

OpenAI slice

Evaluation and Conclusion

The bot actually performs quite well; it does a good job with the summary and responds reasonably to follow-up questions. Like all other GPT generative uses, it suffers from hallucination and repetition.

Is the bot useful? My Slack channels are not very active, so it's not difficult to read the original content or search when I'm curious about a topic. It would certainly be more useful in a channel with a lot of activity. It could be useful in other areas, such as summarizing the week's activity and sending a digest email.

If I find myself @messaging the bot instead of simply scrolling back, I'll know that the such a bot is a winning piece of tech.

Calder White

In the past, when I needed any type of product information like the best phone or cloud provider, I would often turn to Google. Many people do the same, but I've noticed that over time, Google has become more focused on turning a profit which litters my search results with paid advertisements that don’t actually answer my question. A friend suggested to instead append “Reddit” to the end of every Google search… this simple change helped me find more relevant and accurate results.

This inspired me to create a custom newsletter for any subreddit to send me Reddit's "thoughts" every day. Here's how I did it and here's a link to clone the public app and run your own newsletter!

Getting data from Reddit

To begin, I attempted to collect data from Reddit. I initially thought it would be easy, as Reddit is a modern technology company, and assumed I could access their data through an API with the proper credentials. However, I found that I needed to create a developer account and provide my username and password. In order to make it easy for others to replicate my application, I decided to use web scraping as a method to collect the data instead.

At first I looked at the "new" reddit site (reddit.com), only to find it is dynamically generated CSS and is thus hard to pin down from a web scraping perspective.

Confusing Classnames

However, in finding this I realized that dynamic site generation is a relatively new phenomenon and that in the earlier days of the internet people used their actual internet class names and ids to style and organize their web pages. So I turned to old.reddit.com, and sure enough, it was easily scrapable with telling class names such as ".title" and ".entry".

Good Classnames

I broke out Python’s BeautifulSoup and got to work writing a web scraping script in conjunction with the requests module. Another slight problem I encountered was that reddit did have some basic bot protection in their requests, but that was easily circumvented by copying valid requests headers & cookies and adding them to my GET request to make it look like it was coming from a real browser.

Determining Reddit's "Opinion" with OpenAI

To generate Reddit’s "opinion" on posts, I decided to take the comments as one contiguous block of text and summarize it with OpenAI’s Tl;dr feature. This way I left the tough decisions about which comments were more important up to OpenAI’s LLM instead of hard coded logic. One way this could be expanded is if I incorporated the votes of comments into how my summaries are generated, for example filtering out comments whose votes are too low.

The way Tl;dr works is that you simply insert any text up to a token limit and then append the string "Tl;dr" to it. Run that through OpenAI’s completion engine and it will output its best summary of the information provided. One limitation of this is that there is an output token limit of 60 tokens, which means that the summaries OpenAI provides will be quite small. Another tricky limitation was the input token limit which is set at 4000 tokens. Not only did many post’s comment threads exceed this limit, but calculating the exact ratio of character limits to token limits is a bit difficult. OpenAI does not actually provide you with resources to determine what is and is not a token to them. However, they do provide approximations on their website.

[source: https://help.openai.com/en/articles/4936856-what-are-tokens-and-how-to-count-them ]

Their approximation is that 1 token is roughly 4 characters. To stay in the safe zone, I approximated that 1 token is 3 characters, and multiplied the 4000 token limit by the 3 character ratio to give myself a character limit for OpenAI’s completion engine. Additionally, I implemented chunking to allow summarization of all of the comments. I simply chunked the input by the character limit, summmarized the chunks individually and then concatonated the summaries into one master summary. There is room for expansion in this strategy however. One way to achieve this may be to summarize smaller chunks of the comments and then rerun those concatonated summaries back into OpenAI for your final summary. This is essentially recursive summarizing, which I fear may cause issues due to residual errors present in OpenAI’s LLM, but if the model is good enough you might be able to get away with one iteration. This provides the added benefit of cohere text flow, instead of disjoint summaries strung together. As mentioned before, another way summarization could be improved is by filtering for the more popular opinions represented in higher vote posts instead of weighting all comments equally.

Extra Features from Patterns :)

Easy to read crons! Patterns allowed me to set my own crong and also told me in plain english what the schedule was. This saved me the hassle of going to crontab.guru every single time I want to set a crontab.

Crons in Patterns

Some nice built in features Patterns allowed me to have was the node form view option. This way I could easily see what my parameters were and quickly change them. For example, the subreddit or the email I was sending my newsletter to.

It was also nice to be able to use the OpenAI completion component as well as the "Send email with Gmail" component so I didn’t have to write all of the code to interface with these APIs. It allowed me to focus on what I was interested in, which was downloading and ingesting the data from reddit.

Patterns Graph

Wrapping up

There were some really interesting results from Reddit's summaries. Although my algorithm for combining chunks from reddit comments was not perfect, the results produced were very insightful.

In wallstreetbets Reddit advised against pump and dumps

Advising Against Pump and Dumps

Some banter about Jamie Dimon stating the obvious:

Jamie Obvious is Great at Stating the Obvious

Some good guidance on recession fears (with a bit of self promotion noise):

Recession Opinions

I was really impressed with the simplicity in summarizing the opinions with OpenAI + using the prebuilt components from patterns to glue these systems together! I think with some more tweaks you could certainly automate a newsletter and gain thousands of subscribers.

The Code

But the code! Here's a link to the public graph. Feel free to clone it and run your own newsletter!

Matthew Mitchener

When I was a Salesforce developer, I frequently worked with small internal teams within larger organizations. Since traditional AI solutions require large amounts of data and specialized infrastructure to function properly, utilizing AI capabilities was something that a small compliance department or customer service team wouldn’t even consider.

Now with services such as Cohere, you can fine-tune pre-trained Large Language Models (LLMs) and use Patterns to provide easy-to-configure data orchestration with no infrastructure required. No matter what budget or available resources, small teams no longer need to be left behind in the AI revolution and can take advantage of these powerful tools to improve their operations and decision-making.

In this article, I’ll explain how to quickly set up a Salesforce Case classifier using an LLM such as GPT-3. While this is a common use case for AI within Salesforce, this example can be applied to other AI solutions as well.

Goal

In this post, we will use Patterns to fetch data from Salesforce, fine-tune an LLM with Cohere and finally classify Salesforce and upload those classifications back to Salesforce. In the end, we will have built this Salesforce Case Classifier in Patterns. Feel free to clone this one and configure it yourself if you’d like to build it from scratch.

Prerequisites

Import training data into Patterns

  1. Open up Patterns and create a new app (call it anything you’d like)

  2. Inside your graph, click “Search Components” in the nav bar to open up our Marketplace and find a node called “Query Salesforce (SOQL)”

  3. Add this component to your graph and configure the following:

    1. Configure connection to your salesforce connection if one exists. If not, click “Connect to Salesforce”
    2. Set the query to:
    SELECT Id, Type, Subject, Status
    FROM Case
    WHERE Type != null
    AND Status = 'Closed'
  4. Rename the output table “salesforce_training”

Once configured with a Salesforce connection, your app should look like this.

Configuring a Salesforce connection with Patterns

Configure a webhook for incoming Cases to be classified

Patterns provides the ability to trigger graph nodes from a webhook. Unfortunately, Salesforce does not have webhooks support but we can get around this with a little bit of Apex.

Patterns setup

  1. First, let’s start by adding a “Webhook” component in Patterns by clicking the “Add” button in the top left, selecting “Webhook” and placing it on the graph
  2. Open the webhook component and copy its unique URL (we’ll need this later)

Salesforce setup

  1. Start by adding a “Remote Site Setting” by going to Setup > Security > Remote Site Settings and adding an entry for https://api.patterns.app
  2. Next, we need to add the following Apex class. You will need to replace https://api-staging.patterns.app/api/v1/webhooks/your-webhook with the URL we copied earlier (see step 2)
public class Patterns
{
@future(callout=true)
public static void sendToPatterns(Set<Id> caseIds) {
List<Case> cases = [SELECT Id, Subject FROM Case WHERE Id IN: caseIds];

HttpRequest request = new HttpRequest();
request.setEndpoint('https://api-staging.patterns.app/api/v1/webhooks/your-webhook');
request.setMethod('POST');
request.setHeader('Content-Type', 'application/json');
request.setBody(JSON.serialize(cases));

Http http = new Http();
http.send(request);
}
}
  1. Finally, create a new Apex trigger to execute our previous class on Case creation.
trigger CaseClassifier on Case (after insert) {
if(!Trigger.new.isEmpty()) {
Patterns.sendToPatterns(Trigger.newMap.keySet());
}
}

Patterns setup

Back in Patterns, we will now need to do some cleanup with the records we receive through our webhook.

  1. Add a new Python component and paste the following code
from patterns import (
Parameter,
State,
Table,
)

from pandas import DataFrame, concat
import json

webhook_results = Table("webhook_results", "r")
salesforce_testing = Table("salesforce_testing", "w")

stream_results = webhook_results.as_stream(order_by="timestamp")

records = []

for result in stream_results.consume_records():
data = result['record']
record = json.loads(data) if type(data) == str else data
print(data)
records.append(record)

df = DataFrame(records, columns=['Id', 'Subject'])
salesforce_testing.write(df)
  1. Configure your new python component by connecting the webhook_results to the webhook table.
  2. For the salesforce_testing table, we’ll need to create a new table component. Click the dropdown in the editor gutter and select the “create Table Store” option.

Your graph should now look like this:

Screen Shot 2022-12-30 at 8.29.49 PM.png

Cohere setup

Now that we have our training and testing data, let’s set up the classifier

  1. Go back to the Marketplace and search for a component called “Cohere Classify”
  2. Add the component to the graph and configure:
    1. Example Category Column = “Type”
    2. Example Text Column = “Subject”
    3. Input Text Column = “Subject”
    4. Connect cohere_input to the “salesforce_testing” table
    5. Connect cohere_examples to the “salesforce_training” table

In this example, we are classifying Cases based on the “Subject” field and predicting what “Type” it should be. However, free feel to configure whatever fields you like. The finished graph should look like this.

Configuring a Cohere component in Salesforce

Running the graph

Now that you’re all set, time to run our graph. Assuming your Salesforce org already has Cases we can train with, hover over the SOQL node and click the “Run” button (looks like a Play icon). This will run the graph and send our training data to Cohere.

We won’t see any output, so let’s see the result of our work by going back into our Salesforce org and create a new Case, such as the one below:

Creating a Salesforce Case

Shortly after creating a case, you should see the Patterns graph come to life.

Our case with the subject “Having issues with power generation” is given a prediction of the type “Electrical” and a confidence score of 0.909923

Results of our Salesforce Case classifier

Exporting to Salesforce

Our final step is to update Salesforce with the results of our classification engine.

  1. Create a new Python component and copy/paste the following code:
from patterns import (
Parameter,
State,
Table,
Connection
)

import requests
import json

salesforce = Parameter(
'salesforce',
type=Connection("salesforce")
)

access_token = salesforce.get("access_token")
instance_url = salesforce.get("instance_url")

cases = Table('cohere_output')
cases_stream = cases.as_stream()

headers = {"Authorization": f"Bearer {access_token}", "Content-Type": "application/json"}

for c in cases_stream.consume_records():
case_id=c['Id']
prediction=c['prediction']
data={ "Type": c['prediction'] }

result = requests.patch(
url=f'{instance_url}/services/data/v56.0/sobjects/Case/{case_id}',
data=json.dumps(data),
headers=headers
)

result.raise_for_status()
  1. Finally, configure the Salesforce connection and the table associated with our cohere output

By reading our output as a stream, we will only process one case at a single time. This ensures we update Salesforce opportunistically and not with the entire table every time our graph runs.

Conclusion

By utilizing Patterns and Cohere, we were able to build out a simple but powerful Salesforce Case classifier using an LLM. As we collect more data, we can continuously fine-tune our model by manually re-running the graph or scheduling it with a cron job. Hopefully, this helps you get started with not just Salesforce Case classification but also AI solutions such as text summarization, content moderation, and semantic searching. With a tool like Patterns, stitching this all together and deploying AI solutions has never been simpler.

Ken Van Haren

(fyi, here’s the code for everything I built below, you can play around with it in Patterns AI Studio as well.)

When I was at Square and the team was smaller we had a dreaded “analytics on-call” rotation. It was strictly rotated on a weekly basis, and if it was your turn up you knew you would get very little “real” work done that week and spend most of your time fielding ad-hoc questions from the various product and operations teams at the company (SQL monkeying, we called it). There was cutthroat competition for manager roles on the analytics team and I think this was entirely the result of managers being exempted from this rotation -- no status prize could rival the carrot of not doing on-call work.

So, the idea that something like analytics on-call could be entirely replaced by a next-token optimizer like GPT-3 has been an idea I’ve been excited to try for a long time now. I finally got a chance to sit down and try it out this week.

We’re about to kick off our fundraising process, so I to test the idea I attempted to build a free-form question answering analytics bot on top of the Crunchbase data set of investors, companies, and fundraising rounds. I call it CrunchBot.

Read on to get the details, but here is a quick example of it getting a simple thing exactly right:

crunchbot

And an example of it getting something more complex exactly right:

crunchbot

And an example of it getting something complex terrifically wrong (watch your join conditions davinci-003!):

crunchbot

And something of medium complexity mostly right (it’s so close here, needs an ilike instead of like, which it messed up despite a specific prompt telling it to watch out for this mistake):

crunchbot

Overall I was dumbfounded with the quality of the results. LLMs are a continual source of blown minds, but this is shockingly close to replacing an entire role at companies with only a few hours of effort.

How I built it

My plan was to build it in Patterns Studio. There were mostly four parts

  • Build the prompt from
    • user’s question
    • schemas and sample data of the available tables
    • clear directions
  • Run it through various GPT models and get 5+ completions of raw SQL
  • Execute the SQL against the relevant tables, pick the best result
  • Hook it up to a Slack bot

By the end I had a much more complex pipeline as I kept quickly finding prompt improvements. Specifically the SQL generation and execution part became a loop of:

  • Generate a candidate query
  • Quality check the SQL with GPT itself, asking it to spot common errors (NULLS LAST, for instance) and produce a correct version of the query
  • Run the SQL against the tables
  • If there was an error or no result, ask GPT to fix the query to produce a correct result and repeat the loop
  • Otherwise, return the result

This led to completion chains of over 20 calls to GPT for a single user question. There feels like some logarithmic improvement in each GPT call — you can continue to add more context and checks with every completion, exploring different versions and iterating on the result. This is the same process that a junior analyst would use to arrive at the answer, in this case it takes 15 seconds and costs $1 in credits vs $50 and 1 hour for the analyst. You have a LOT of leeway there to use even more crazy prompt pipelines before the ROI gets bad.

Anyways, here’s the step-by-step of how I built it. You can follow along in this template app on Patterns that has all the code (no data it in, Crunchbase is a proprietary data set — reach out kvh@patterns.app if you are interested in exploring this specific data set).

1. Get the Crunchbase data

The full Crunchbase dataset includes 2.4m organizations and 510k funding rounds. We ingest this via the full CSV dump every 24 hours into our postgres instance. For this analysis we restricted it to three tables: organizations, funding_rounds, and investments.

2. Build the initial prompt

The initial SQL generation prompt includes three basic elements: a summary of the tables and data available to query, the user’s question, and a prompt asking GPT to write a correct Postgres query. Here’s the exact template we used:

prompt = f"""{tables_summary}

As a senior analyst, given the above schemas and data, write a detailed and correct Postgres sql query to answer the analytical question:

"{question}"

Comment the query with your logic."""

Which results in this full prompt, for example:

Schema for table: organizations
uuid Text
name Text
roles Text
country_code Text
region Text
city Text
status Text
short_description Text
category_list Text
num_funding_rounds Float
total_funding_usd Float
founded_on Date
employee_count Text
email Text
primary_role Text

Data for table: organizations:
uuid name roles \
0 ac323097-bdd0-4507-9cbc-6186e61c47a5 Bootstrap Enterprises company
1 717ce629-38b6-494d-9ebf-f0eeb51506f8 Campanizer company
2 c8cbaa69-c9db-44e2-9ffa-eb4722a62fe3 Cambr company
3 5ab1ae3d-c3a1-4268-a532-b500d3dd6182 CallMeHelp company
4 143f840b-551c-4dbd-a92b-0804d654b5cf California Cannabis Market company

country_code region city status \
0 <NA> <NA> <NA> operating
1 USA Colorado Boulder operating
2 USA New York New York operating
3 GBR Stockport Stockport operating
4 USA California San Francisco closed

short_description \
0 Bootstrap Enterprises is an organic waste mana...
1 Campanizer organizes schedule and coordinates ...
2 Cambr enables companies to build and scale fin...
3 CallMeHelp provides early warning and care ove...
4 California Cannabis Market is an information t...

category_list num_funding_rounds \
0 Consulting,Organic,Waste Management NaN
1 Information Technology,Scheduling NaN
2 Banking,Financial Services NaN
3 Fitness,Health Care,Wellness NaN
4 B2B,Information Services,Information Technology NaN

total_funding_usd founded_on employee_count email \
0 NaN NaT unknown <NA>
1 NaN 2017-01-01 1-10 hello@campanizer.com
2 NaN NaT unknown sales@cambr.com
3 NaN 2017-01-01 1-10 <NA>
4 NaN 2018-01-01 1-10 <NA>

primary_role
0 company
1 company
2 company
3 company
4 company


Schema for table: investments
uuid Text
name Text
funding_round_uuid Text
funding_round_name Text
investor_uuid Text
investor_name Text
investor_type Text
is_lead_investor Boolean

Data for table: investments:
uuid \
0 524986f0-3049-54a4-fa72-f60897a5e61d
1 6556ab92-6465-25aa-1ffc-7f8b4b09a476
2 0216e06a-61f8-9cf1-19ba-20811229c53e
3 dadd7d86-520d-5e35-3033-fc1d8792ab91
4 581c4b38-9653-7117-9bd4-7ffe5c7eba69

name \
0 Accel investment in Series A - Meta
1 Greylock investment in Series B - Meta
2 Meritech Capital Partners investment in Series...
3 Trinity Ventures investment in Series B - Phot...
4 Founders Fund investment in Series A - Geni

funding_round_uuid funding_round_name \
0 d950d7a5-79ff-fb93-ca87-13386b0e2feb Series A - Meta
1 6fae3958-a001-27c0-fb7e-666266aedd78 Series B - Meta
2 6fae3958-a001-27c0-fb7e-666266aedd78 Series B - Meta
3 bcd5a63d-ed99-6963-0dd2-e36f6582f846 Series B - Photobucket
4 60e6afd9-1215-465a-dd17-0ed600d4e29b Series A - Geni

investor_uuid investor_name \
0 b08efc27-da40-505a-6f9d-c9e14247bf36 Accel
1 e2006571-6b7a-e477-002a-f7014f48a7e3 Greylock
2 8d5c7e48-82da-3025-dd46-346a31bab86f Meritech Capital Partners
3 7ca12f7a-2f8e-48b4-a8d1-1a33a0e275b9 Trinity Ventures
4 fb2f8884-ec07-895a-48d7-d9a9d4d7175c Founders Fund

investor_type is_lead_investor
0 organization True
1 organization True
2 organization True
3 organization <NA>
4 organization True


Schema for table: funding_rounds
uuid Text
region Text
city Text
investment_type Text
announced_on Date
raised_amount_usd Float
post_money_valuation_usd Float
investor_count Float
org_uuid Text
org_name Text
lead_investor_uuids Text

Data for table: funding_rounds:
uuid region city \
0 8a945939-18e0-cc9d-27b9-bf33817b2818 California Menlo Park
1 d950d7a5-79ff-fb93-ca87-13386b0e2feb California Menlo Park
2 6fae3958-a001-27c0-fb7e-666266aedd78 California Menlo Park
3 bcd5a63d-ed99-6963-0dd2-e36f6582f846 Colorado Denver
4 60e6afd9-1215-465a-dd17-0ed600d4e29b California West Hollywood

investment_type announced_on raised_amount_usd post_money_valuation_usd \
0 angel 2004-09-01 500000.0 NaN
1 series_a 2005-05-01 12700000.0 98000000.0
2 series_b 2006-04-01 27500000.0 502500000.0
3 series_b 2006-05-01 10500000.0 NaN
4 series_a 2007-01-17 NaN 10000000.0

investor_count org_uuid org_name \
0 4.0 df662812-7f97-0b43-9d3e-12f64f504fbb Meta
1 4.0 df662812-7f97-0b43-9d3e-12f64f504fbb Meta
2 5.0 df662812-7f97-0b43-9d3e-12f64f504fbb Meta
3 2.0 f53cb4de-236e-0b1b-dee8-7104a8b018f9 Photobucket
4 1.0 4111dc8b-c0df-2d24-ed33-30cd137b3098 Geni

lead_investor_uuids
0 3f47be49-2e32-8118-01a0-31685a4d0fd7
1 b08efc27-da40-505a-6f9d-c9e14247bf36
2 e2006571-6b7a-e477-002a-f7014f48a7e3,8d5c7e48-...
3 <NA>
4 fb2f8884-ec07-895a-48d7-d9a9d4d7175c


As a senior analyst, given the above schemas and data, write a detailed and correct Postgres sql query to answer the analytical question:

"Who were the largest biotech investors in 2022?"

Comment the query with your logic.

3. Double check the query

I found GPT made some common mistakes over and over again (the same ones any analyst would make), so I gave it a specific prompt to review each query and fix any bugs before doing anything else:

prompt = f"""{query.sql}

Double check the Postgres query above for common mistakes, including:
- Remembering to add `NULLS LAST` to an ORDER BY DESC clause
- Handling case sensitivity, e.g. using ILIKE instead of LIKE
- Ensuring the join columns are correct
- Casting values to the appropriate type

Rewrite the query here if there are any mistakes. If it looks good as it is, just reproduce the original query."""

4. Run the generated SQL against the database, fix any errors

Next we try to run the SQL against the database. If it produces a result, we store the result and query. If it produces no result or an error, we ask GPT to fix the SQL:

error_prompt = f"""{query.sql}

The query above produced the following error:

{query.error}

Rewrite the query with the error fixed:"""

no_result_prompt = f"""{query.sql}

The query above produced no result. Try rewriting the query so it will return results:"""

Here’s an example of this step working well, with the following query. Can you spot the error?

SELECT org_category,
SUM(CASE WHEN YEAR(announced_on) = 2021 THEN raised_amount_usd ELSE 0 END) as 2021_investments,
SUM(CASE WHEN YEAR(announced_on) = 2022 THEN raised_amount_usd ELSE 0 END) as 2022_investments,
SUM(CASE WHEN YEAR(announced_on) = 2022 THEN raised_amount_usd ELSE 0 END) - SUM(CASE WHEN YEAR(announced_on) = 2021 THEN raised_amount_usd ELSE 0 END) as diff_investments
FROM organizations o JOIN funding_rounds f ON o.uuid = f.org_uuid
GROUP BY org_category
ORDER BY diff_investments DESC NULLS LAST
LIMIT 1;

Syntax error:

ERROR:  syntax error at or near "2021_investments"
LINE 2: ..._on) = 2021 THEN raised_amount_usd ELSE 0 END) as 2021_inves...

Which was then fixed with this new query:

SELECT org_category,
SUM(CASE WHEN YEAR(announced_on) = 2021 THEN raised_amount_usd ELSE 0 END) as investments_2021,
SUM(CASE WHEN YEAR(announced_on) = 2022 THEN raised_amount_usd ELSE 0 END) as investments_2022,
SUM(CASE WHEN YEAR(announced_on) = 2022 THEN raised_amount_usd ELSE 0 END) - SUM(CASE WHEN YEAR(announced_on) = 2021 THEN raised_amount_usd ELSE 0 END) as diff_investments
FROM organizations o JOIN funding_rounds f ON o.uuid = f.org_uuid
GROUP BY org_category
ORDER BY diff_investments DESC NULLS LAST
LIMIT 1;

5. Repeat N times

Repeat the above completion loop as many times as we want to get a set of queries and results. I chose to stop this loop once I got a result that matched a previous result, or I hit my limit of max tries (5 in this case).

6. Build the Slack bot

I used the off-the-shelf Patterns template for Slack bots and hooked it up. I added a second slack node for acknowledging the original Slack mention quickly, since the full GPT pipeline can take 20 seconds plus.

Conclusion

It seems like there’s almost no limit to how good GPT could get at this. The remaining failure modes were ones of either missing context or not enough iterative debugging (the kind that is the beating heart of any analytics endeavor). For instance, GPT had to guess the exact names and spellings of categories or company names when answering questions. If it was allowed to run some “research” queries first, it could have been able to build enough context for a final prompt and query to get to the right answer. Playing around with GPT at this level you get the feeling that “recursive GPT” is very close to AGI. You could even ask GPT to reinforcement learn itself, adding new prompts based on fixes to previous questions. Of course, who knows what will happen to all this when GPT-4 drops.