
(fyi, here’s the code for everything I built below, you can play around with it in Patterns Studio as well.)
I discussed replacing a SQL analyst with recursive GPT prompts in my last post, in which I had some surprising, but limited, success getting GPT to answer analytical questions with SQL. Astute commenters on HN were quick to point out I hadn’t really replaced anyone:
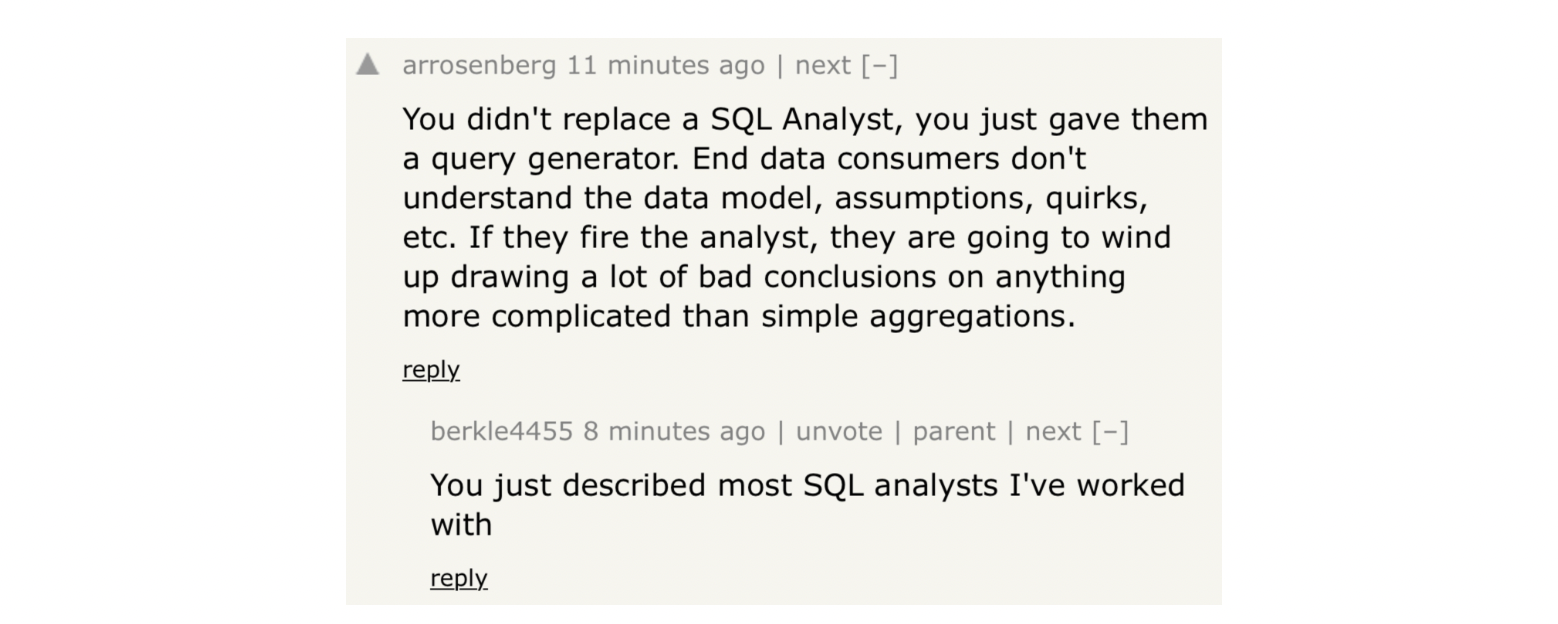
Both the comment and the reply have merit — analysis is hard! The reality is that no SQL analyst is productive at a company on day one. You must learn the tables, the business, and the quirks of logic. Additionally, an analyst is responsible for not just producing the correct SQL and result, but working iteratively with the stakeholder and communicating the result effectively and with the right context.
Well, .... can GPT do these things too?
Can we teach it the quirks of our dataset over time? Can we get it to produce charts to visually communicate its results? Can we have it work interactively to refine and drill in to answers?
I gave it a go with a few more hours of my time. Last time I used the Crunchbase database to build CrunchBot to answer fundraising related questions. This time, I used a public postgres database filled with mock ecommerce data, a data source anyone could play with. I call it ChartBot. Could it replace Tableau at your organization? Read on to find out, but here is a quick review of my success...
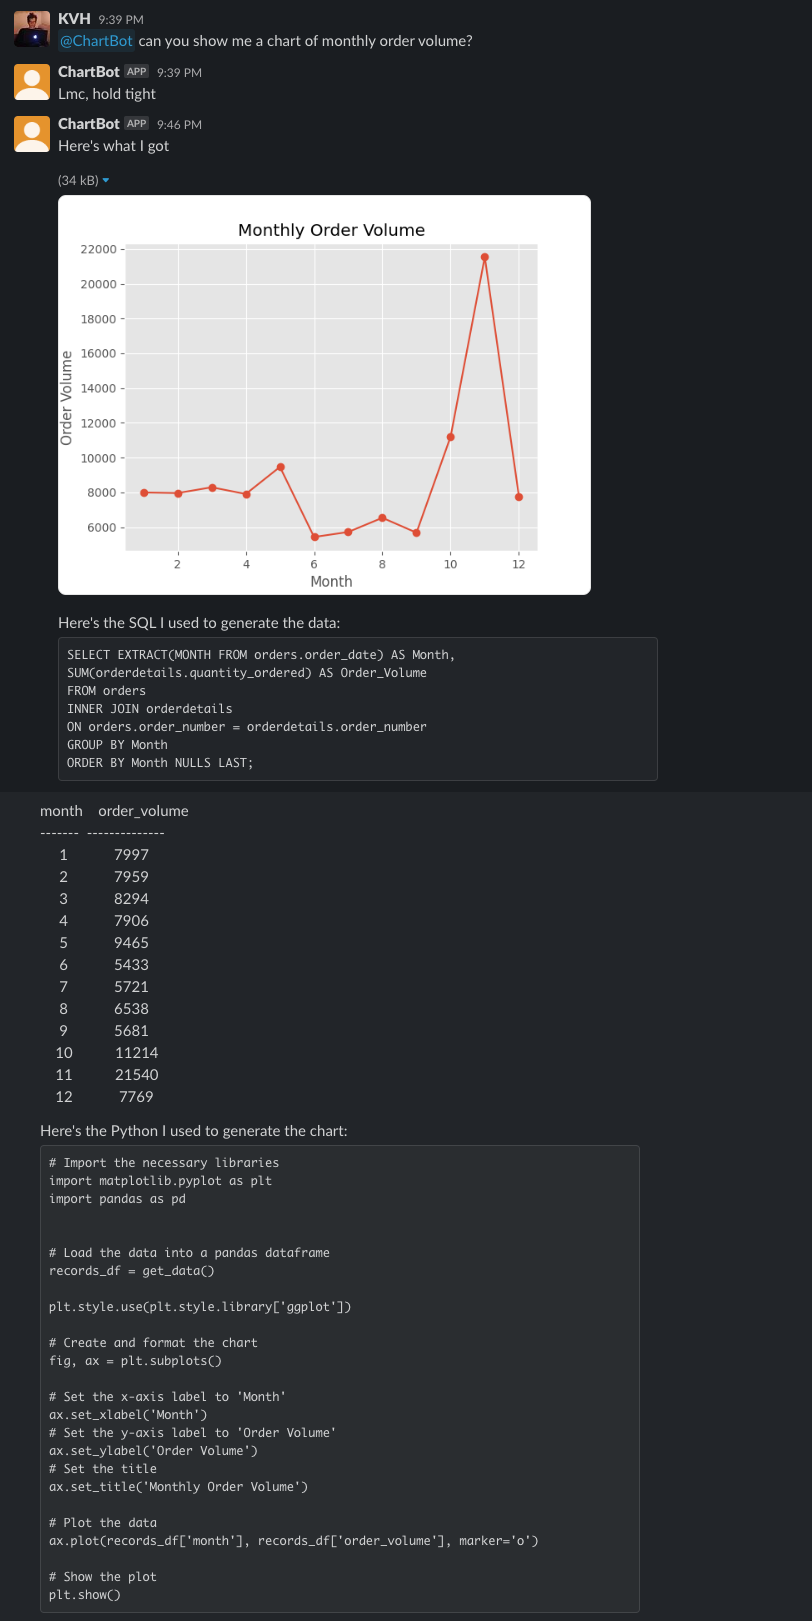
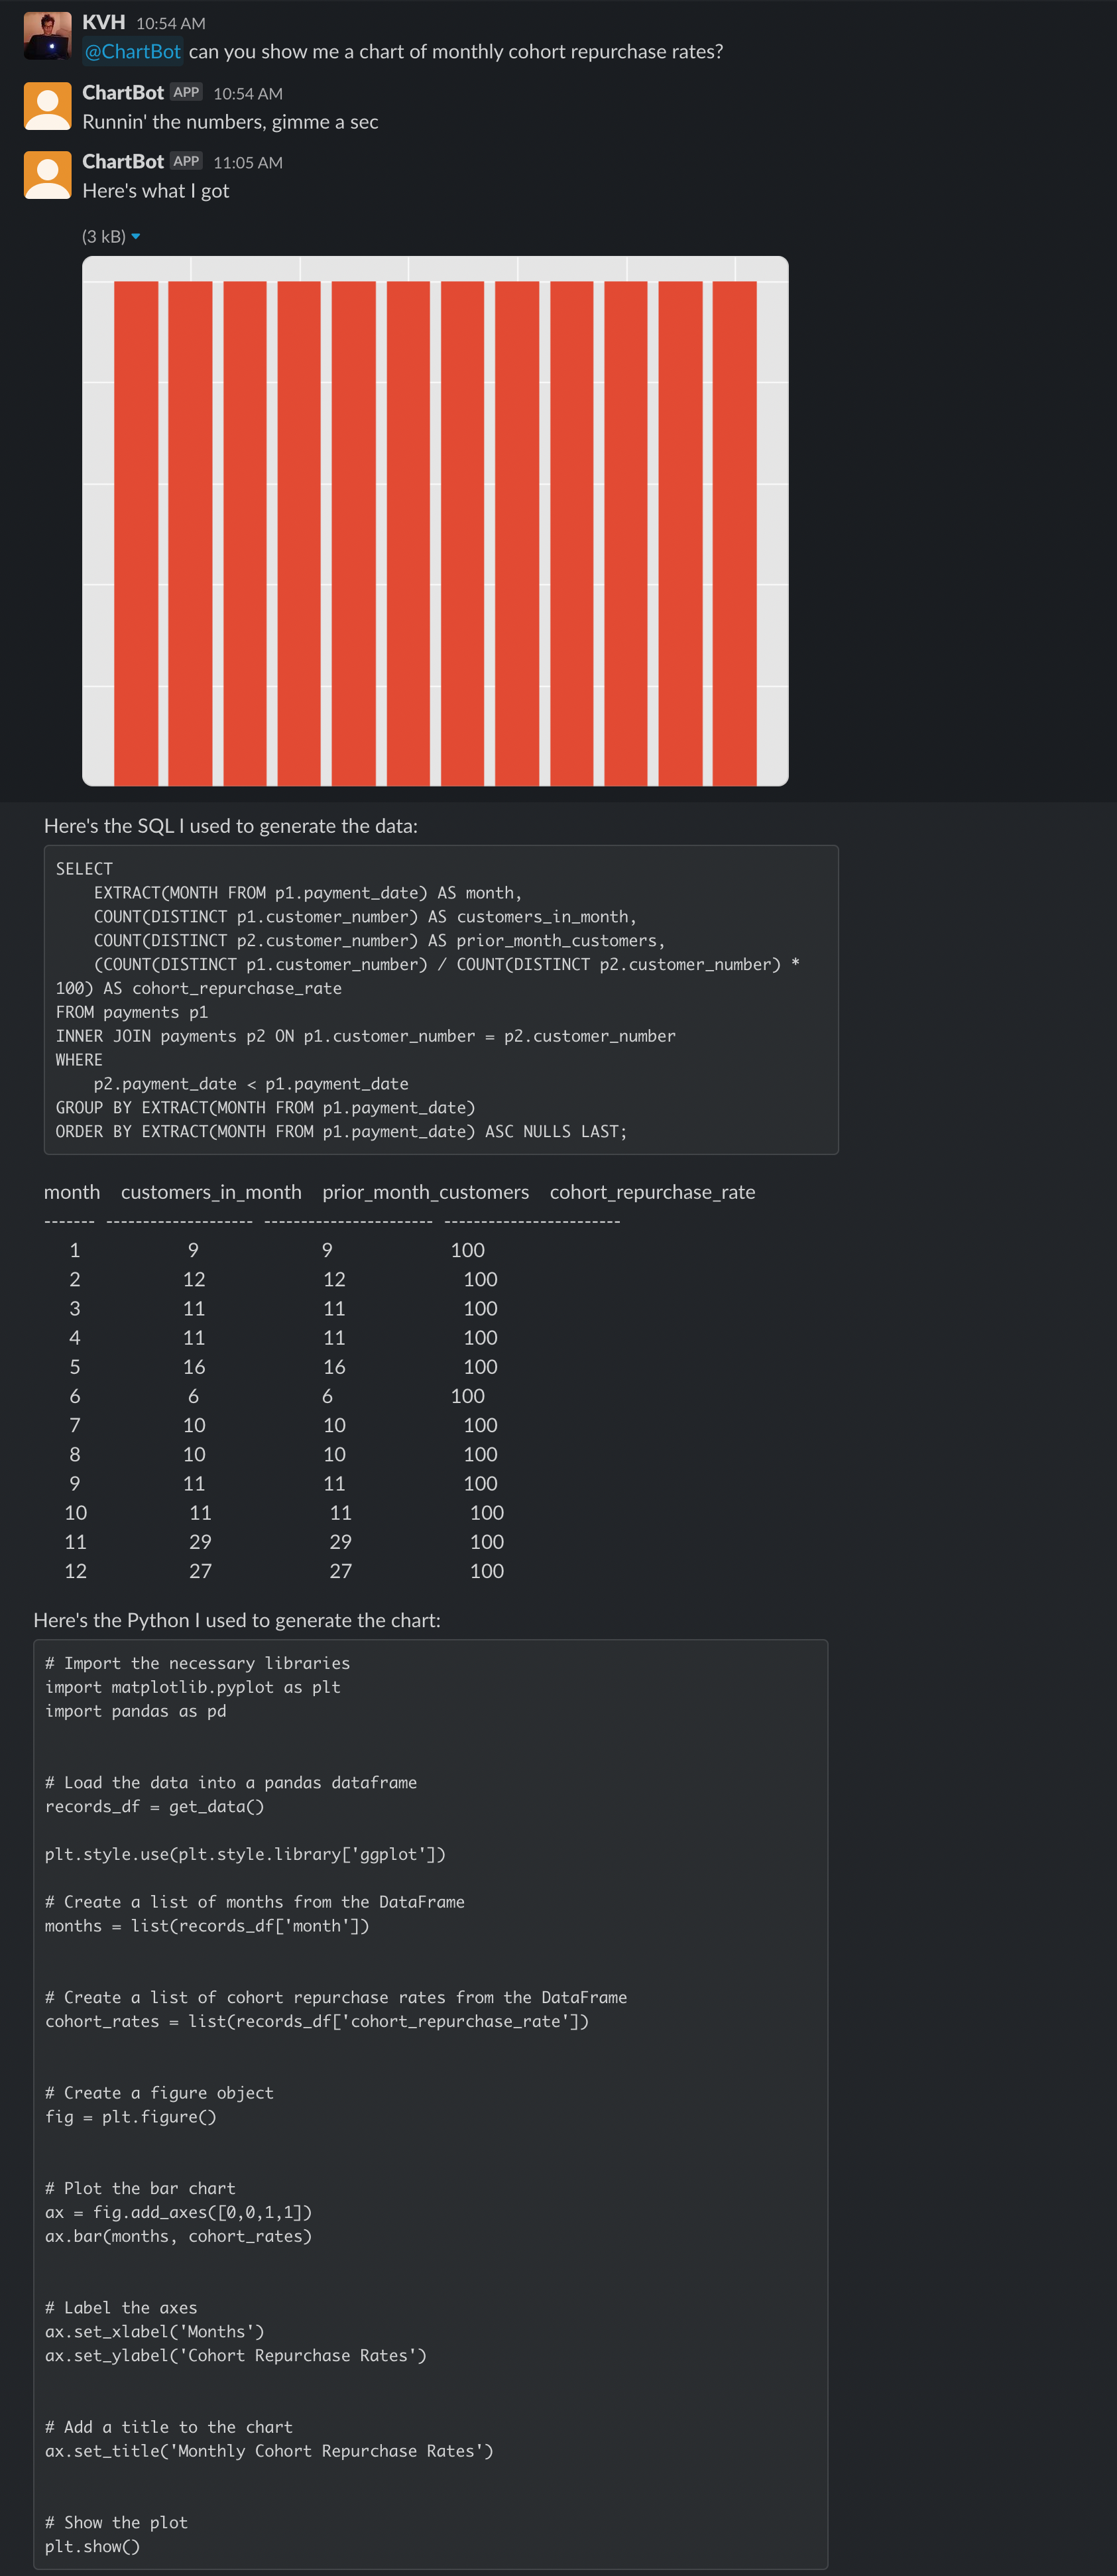
...and failure (valiant effort, this is tough one!):
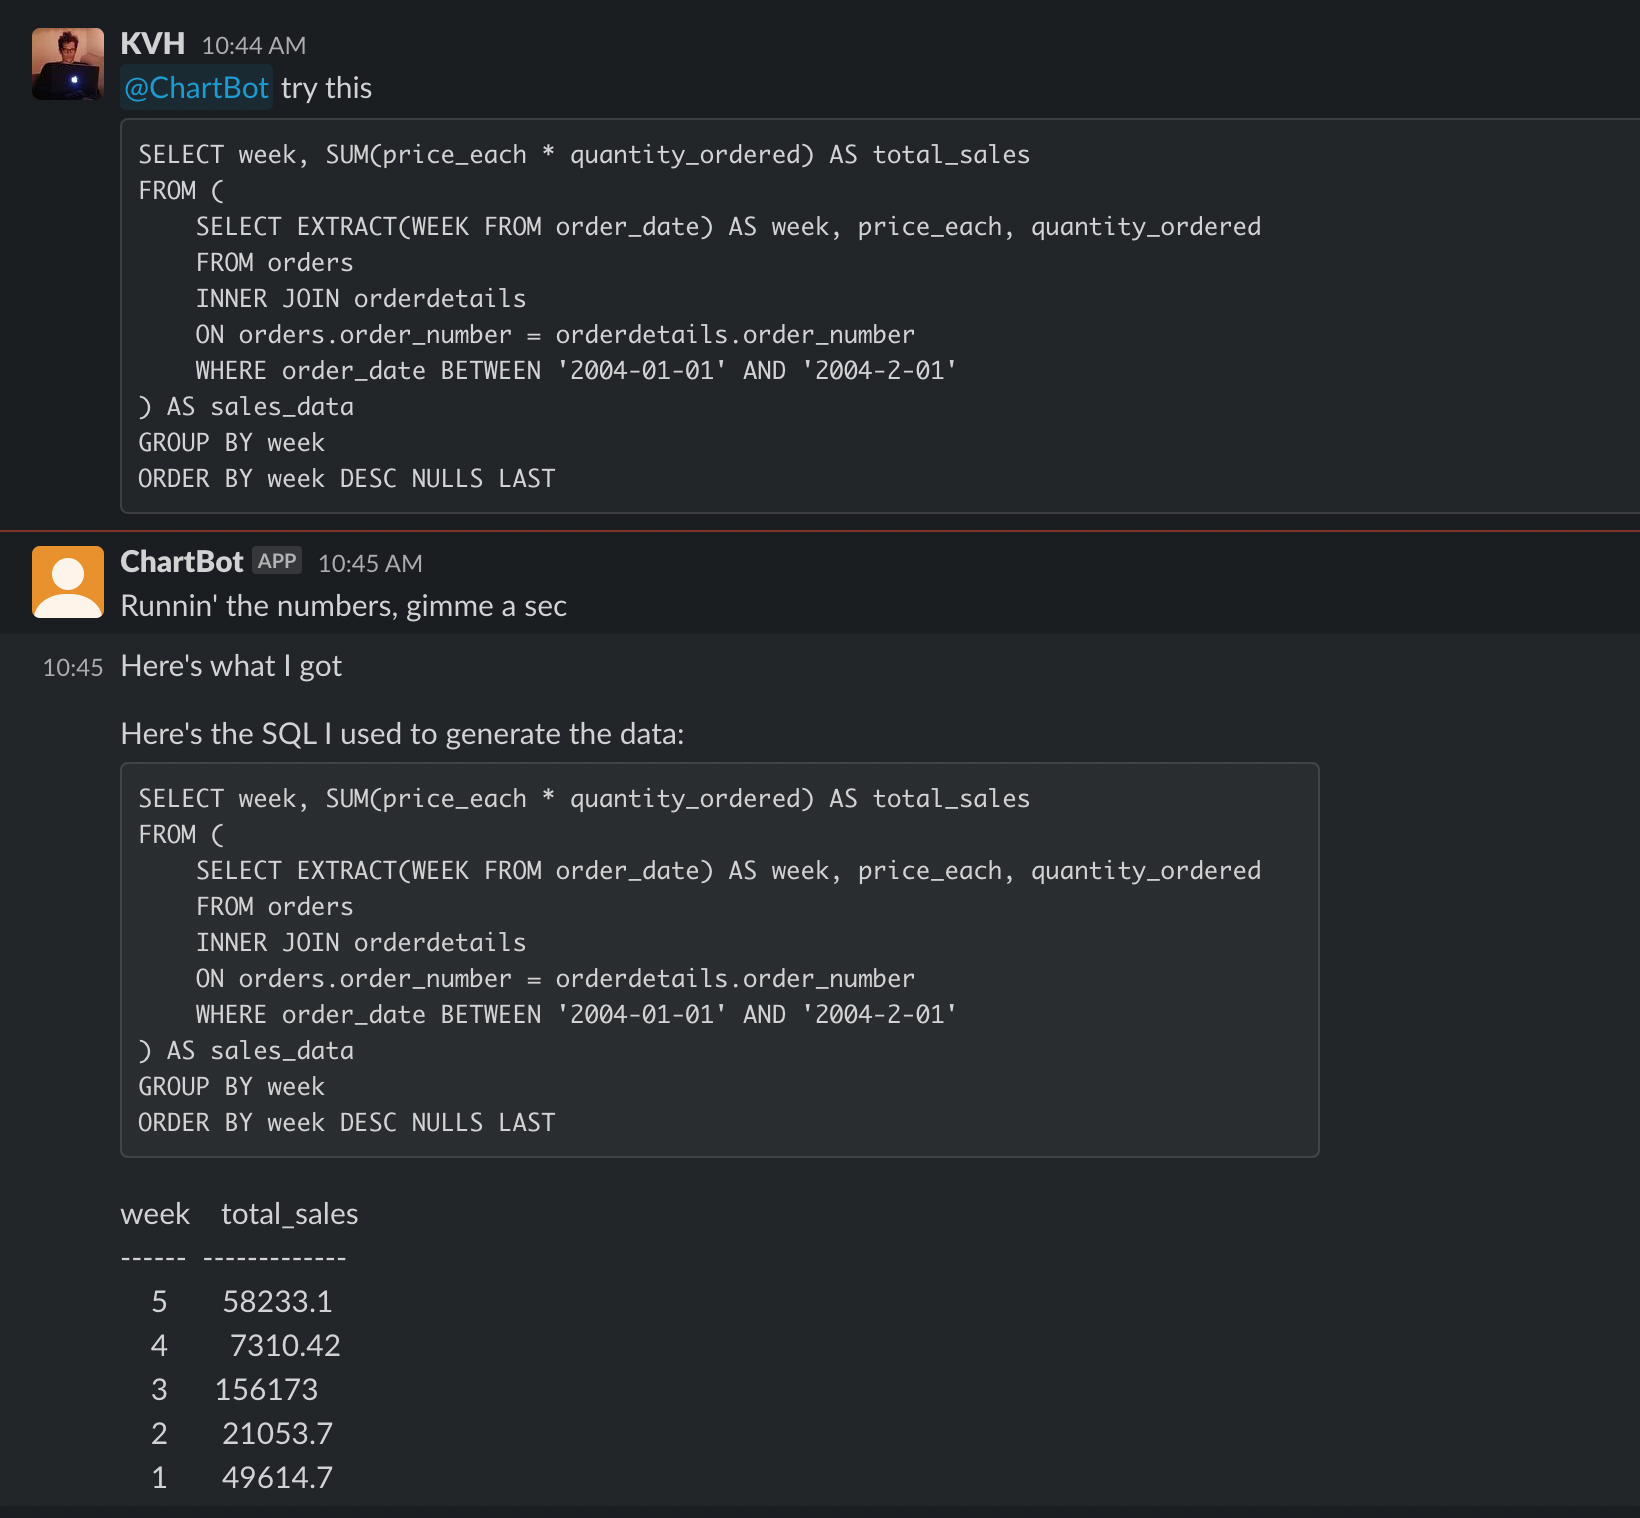
Here's it getting a SQL query correct, but missing the right date filters
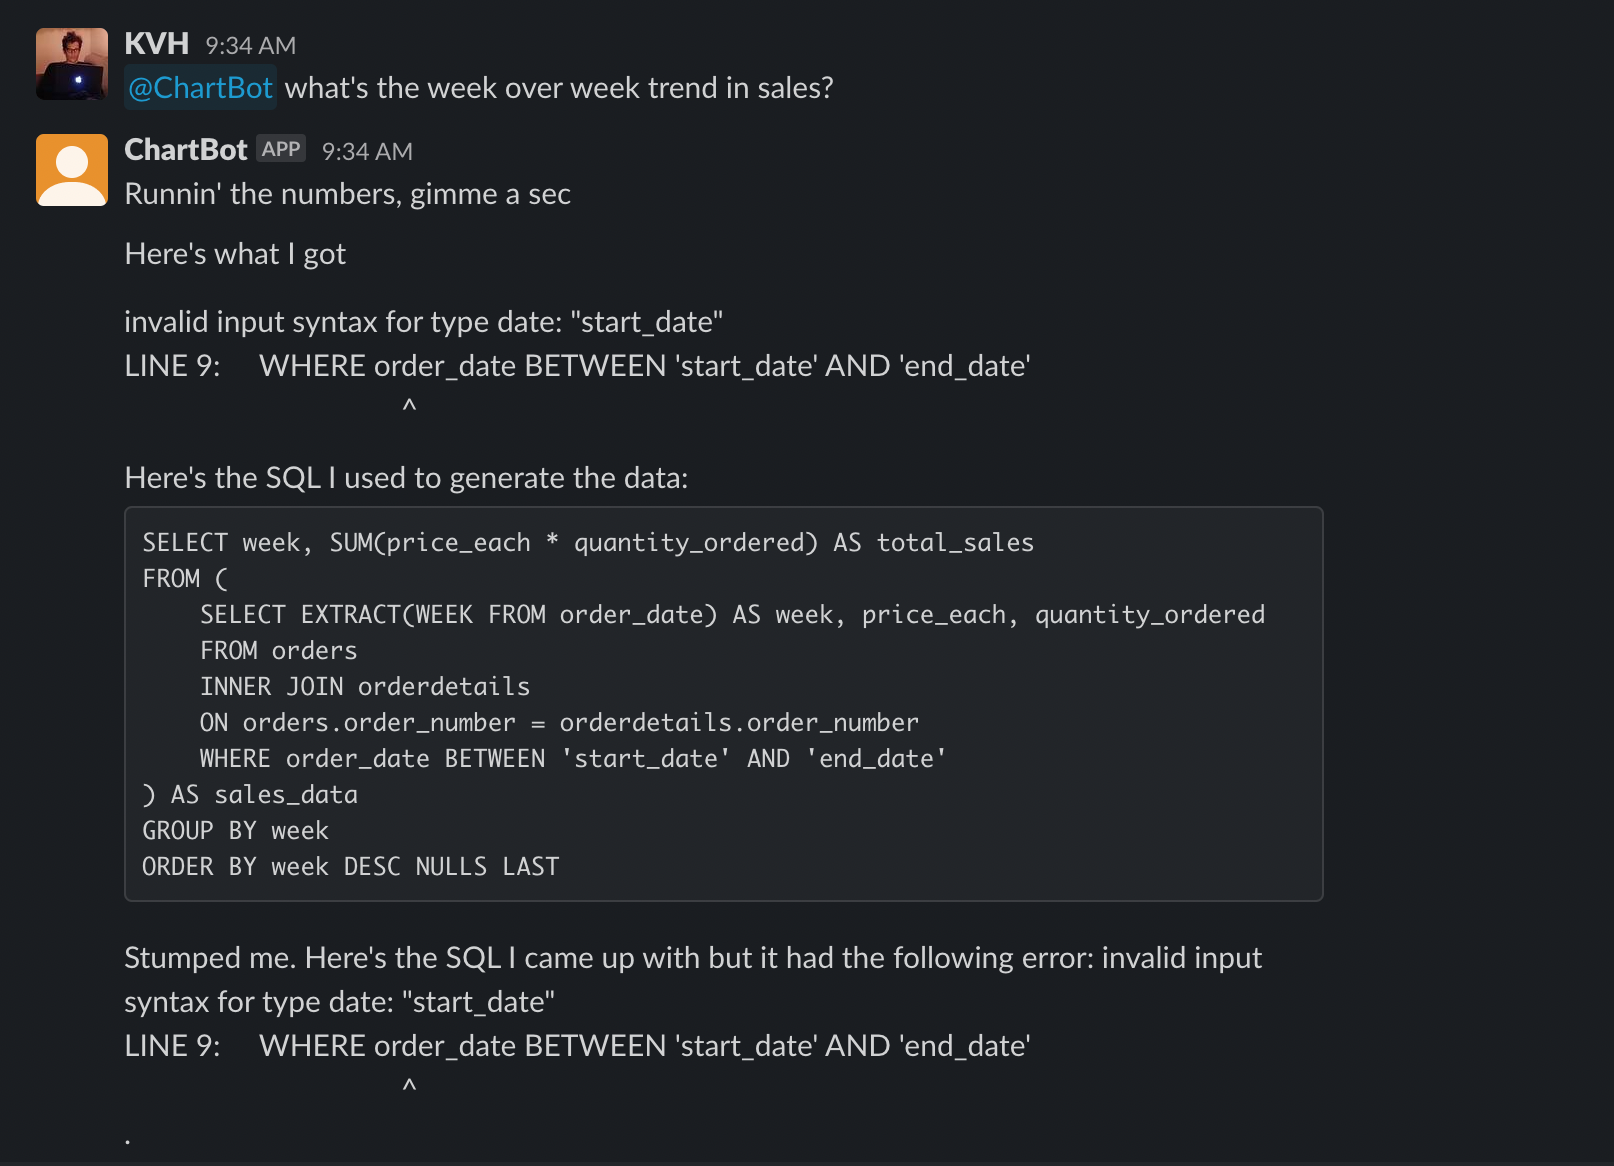
And me editing the SQL, sending it back, and getting the correct result:
Overall, I found ChartBot to be quite good at producing basic charts and analytics, and the ability to refine and resubmit a response really changes the practical value of the bot. It suffers in handling more complex analytical queries (like monthly cohort repurchase rates) but so would any human with no extra context or help.
How I built it
The idea was to augment my existing SQL bot with these new capabilities:
- Ability to fulfill a request for a chart or visualization
- Ability to handle raw (corrected) sql and execute it
- Ability to detect and route between all the intents
Here's the flow I ended up with:
- Detect intent of message: data request, chart request, or SQL request
- If data request:
- GPT completion to generate candidate SQL
- Completion to double check the SQL
- Run the SQL
- If errors, ask GPT to fix and then re-run the SQL
- Run the above steps as many times until successful result or hit limit (5) attempts
- If chart request
- Run the above SQL pipeline, but asking GPT to generate the necessary data for the requested chart
- Take the resulting data and feed a sample into a prompt asking GPT to produce a matplotlib chart
- Attempt to
exec()the resulting python code and capture the matplotlib output - If errors, ask GPT to fix and re-run
- Run the above steps as many times until successful result or hit limit (5) attempts
- If SQL request
- Extract the raw SQL from the request
- Run the SQL
- Return all and any results or errors via Slack
There are many obvious extensions and improvements to this flow, the biggest one being iterative refinement with ChartBot to fix and develop more complex answers. We will save these for part III.
Prompt routing
First, I needed to detect the intent of the message and route to the correct flow.
Here’s the prompt I used to route the requests:
prompt = f"""Classify the following message according to whether it is a SQL query, a data request, or a chart request. Examples:

message: how many new customers were added last year?
class: data request

message: what's the average LTV of a customer?
class: data request

message: show me the trend in house prices over the last 5 years
class: chart request

message: plot a graph of miles vs heartrate, grouped by age group
class: chart request

message: SELECT * FROM customers ORDER BY date
class: sql query

message: {question}
class:
"""
I spent a couple minutes making this list, never touched it again, and it never failed to do the right thing. GPT-3 absolutely crushes these type of general language classification tasks.
Charting with Matplotlib
Charting turned out to be pretty straight forward as well: Ask gpt to write the sql for the data for the requested chart, then ask it to write matplotlib code given the sql result to produce the chart.
To generate the data, I used a prompt very similar to the original SQL generating prompt:
prompt = f"""{tables_summary}

As a senior analyst, given the above schemas and data, write a detailed and correct
Postgres sql query to produce data for the following requested chart:

"{question}"

Comment the query with your logic."""
(The "as a senior analyst" bit has no effect as far as I can tell, you can say "as a bumbling new-hire analyst" and it seems to do just as well, but no harm in hyping GPT up a bit)
This then went through the same original error-correcting prompt loop as in the original SQL bot. We then run the SQL, producing a data set that we can feed into our python charting code.
To build the matplotlib charting prompt, we show GPT the data we got in the previous step and ask it to write matplotlib code. Which it does. I had more luck giving it a pandas dataframe then raw dicts for the input data:
prompt = f"""

records_df = pd.DataFrame.from_records({result})

As a senior analyst, given the above data set, write detailed and correct
matplotlib code to produce a chart as requested:

"{question}"

Comment the code with your logic.

```python
# Import the necessary libraries
import matplotlib.pyplot as plt
import pandas as pd

# Load the data into a pandas dataframe
records_df = get_data()

"""
We then raw exec() the resulting python code — nightmare fuel for the AI safety crowd — and run the code through a error-correcting pipeline similar to the one we used for SQL.
Here’s an example of it doing a great job correcting a simple mistake — can you catch it?
# import the necessary libraries
import matplotlib.pyplot as plt
import pandas as pd

# Load the data into a pandas dataframe
records_df = get_data()

# subset to only series a rounds
series_a = records_df[funding_rounds['investment_type'] == 'series_a']

# get the year for each series a round
series_a['year'] = series_a['announced_on'].apply(lambda x: x.split('-')[0])

# group by year and sum the raised_amount_usd
series_a_per_year = series_a.groupby('year')['raised_amount_usd'].sum()

# plot the data
plt.plot(series_a_per_year.index, series_a_per_year.values)

# set the title and labels
plt.title('Trend in Series A Dollars Over Last Five Years')
plt.xlabel('Year')
plt.ylabel('Raised Amount (USD)')

# show the plot
plt.show()
The error:
11:04:56 AM: AttributeError("'Timestamp' object has no attribute 'split'")
  File "/python.py", line 40, in <module>
    series_a['year'] = series_a['announced_on'].apply(lambda x: x.split('-')[0])
  File "/basis/protocol-container/.venv/lib/python3.10/site-packages/pandas/core/series.py", line 4771, in apply
    return SeriesApply(self, func, convert_dtype, args, kwargs).apply()
  File "/basis/protocol-container/.venv/lib/python3.10/site-packages/pandas/core/apply.py", line 1105, in apply
    return self.apply_standard()
  File "/basis/protocol-container/.venv/lib/python3.10/site-packages/pandas/core/apply.py", line 1156, in apply_standard
    mapped = lib.map_infer(
  File "pandas/_libs/lib.pyx", line 2918, in pandas._libs.lib.map_infer
  File "/python.py", line 40, in <lambda>
    series_a['year'] = series_a['announced_on'].apply(lambda x: x.split('-')[0])
GPT got confused about the data type (str vs datetime). When we feed it the original code and the error and ask it to fix it though:
prompt = f"""

{result.python}

{result.error}

Above is the code and the error it produced. Here is the corrected code:

"""
It produces the corrected code:
# import the necessary libraries
import matplotlib.pyplot as plt
import pandas as pd

# Load the data into a pandas dataframe
records_df = get_data()

# subset to only series a rounds
series_a = records_df[funding_rounds['investment_type'] == 'series_a']

# get the year for each series a round
series_a['year'] = series_a['announced_on'].dt.year

# group by year and sum the raised_amount_usd
series_a_per_year = series_a.groupby('year')['raised_amount_usd'].sum()

# plot the data
plt.plot(series_a_per_year.index, series_a_per_year.values)

# set the title and labels
plt.title('Trend in Series A Dollars Over Last Five Years')
plt.xlabel('Year')
plt.ylabel('Raised Amount (USD)')

# show the plot
plt.show()
Raw SQL execution
In this upgraded bot we wanted to also give the user the ability to send back corrected SQL, since GPT often misses the mark by just a bit. This just required detecting a message as raw SQL and then making sure we extract only the SQL out of the message, which GPT is quite good at:
prompt = """Reproduce the SQL statement from the following, exactly as written:

{sql}

```sql
"""
Conclusions
ChartBot is fundamentally very broken -- it gets a lot of simpler questions wrong and most of the hard ones. The reality though is that it is still actually genuinely useful! More as a code assist technology than a true replacement. It saves a lot of effort -- looking up joins and columns, fiddling with sql, remembering charting syntax -- are all time conuming and painful. ChartBot does 50-90% of the work for you. The ability to send back corrected code fills the final gap and places you in the editor seat. I did not set out to build something actually useful at the start of this project, more of an experiment, but with a couple weeks of tinkering I’ve built something that, with a bit more work and polish, feels like it could change the way I work with data.
It would be dismissive to think that something like ChartBot couldn't also learn over time, like any human anlyst would, and get to the point where it is no longer just an assistive technology but a truly disruptive one. If you train it over a month or two on good and bad examples that it can build an embedding index against and include in its prompt (or use an existing corpus of queries your company probably already has), how much more accurate and reliable could it become? Is dialogue with an AI the future interface to all data? We will test some of these ideas in part III, stay tuned.