
Announcing Auto Code, Patterns' new conversational interface which allows you to use AI to create Python and SQL to extract insights from your data. It's powered by OpenAI's GPT-3 and gives you an instant productivity boost.
Auto Code enables technical users to move even faster by allowing them to describe what they want in English. Auto Code knows the shape of your data, how it is connected, and what APIs are available. It uses this information to generate code that works with your specific data.
In this blog, I'll show you how to get started with Auto Code and how it works behind the scenes.
You can follow along with these directions to try it out yourself. You'll need a Patterns account and an empty graph. Your generated code may look different from mine, depending on whatever randomness OpenAI injects.
(Note: there are still some programmerish concepts in the prompts like rows, records, and snake case ... but you get the idea.)
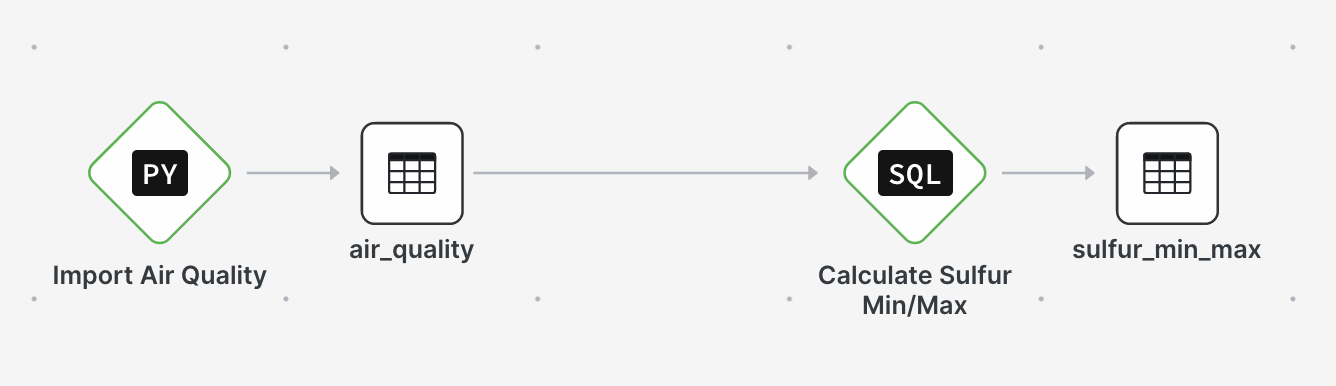
When we are all done, our final graph will look like this:
Invoke Auto Code
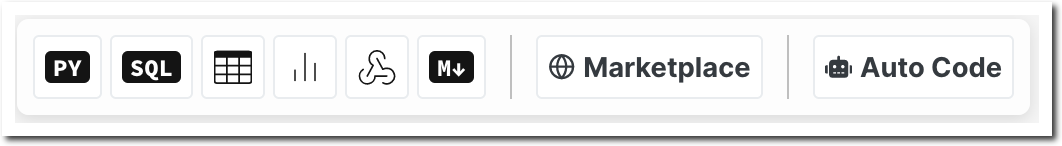
Auto Code is a new button at the top of the graph. Click it to open the conversational interface.
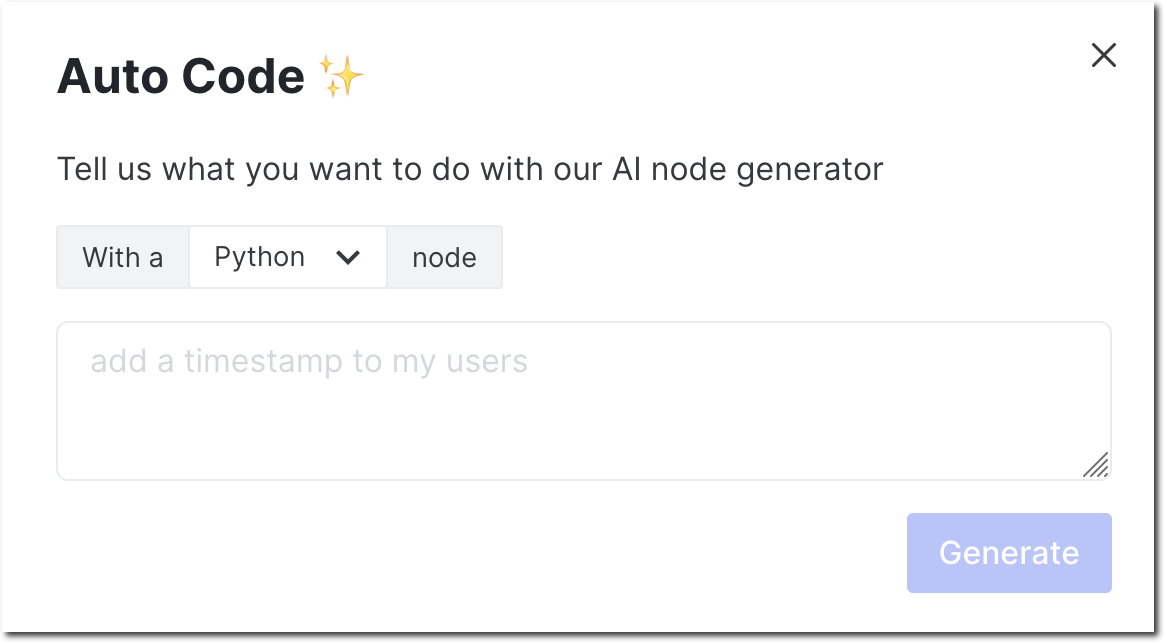
The Auto Code dialog reads like a sentence that you must complete. Just tell it what you want to do, and it will create the code for you. For example: With a Python node add a timestamp to my users.
Building with Auto Code
Let's see how Auto Code works by building a simple graph that plays with air quality data from New York. We'll start with a blank graph and build it up using Auto Code.
Import the air quality CSV
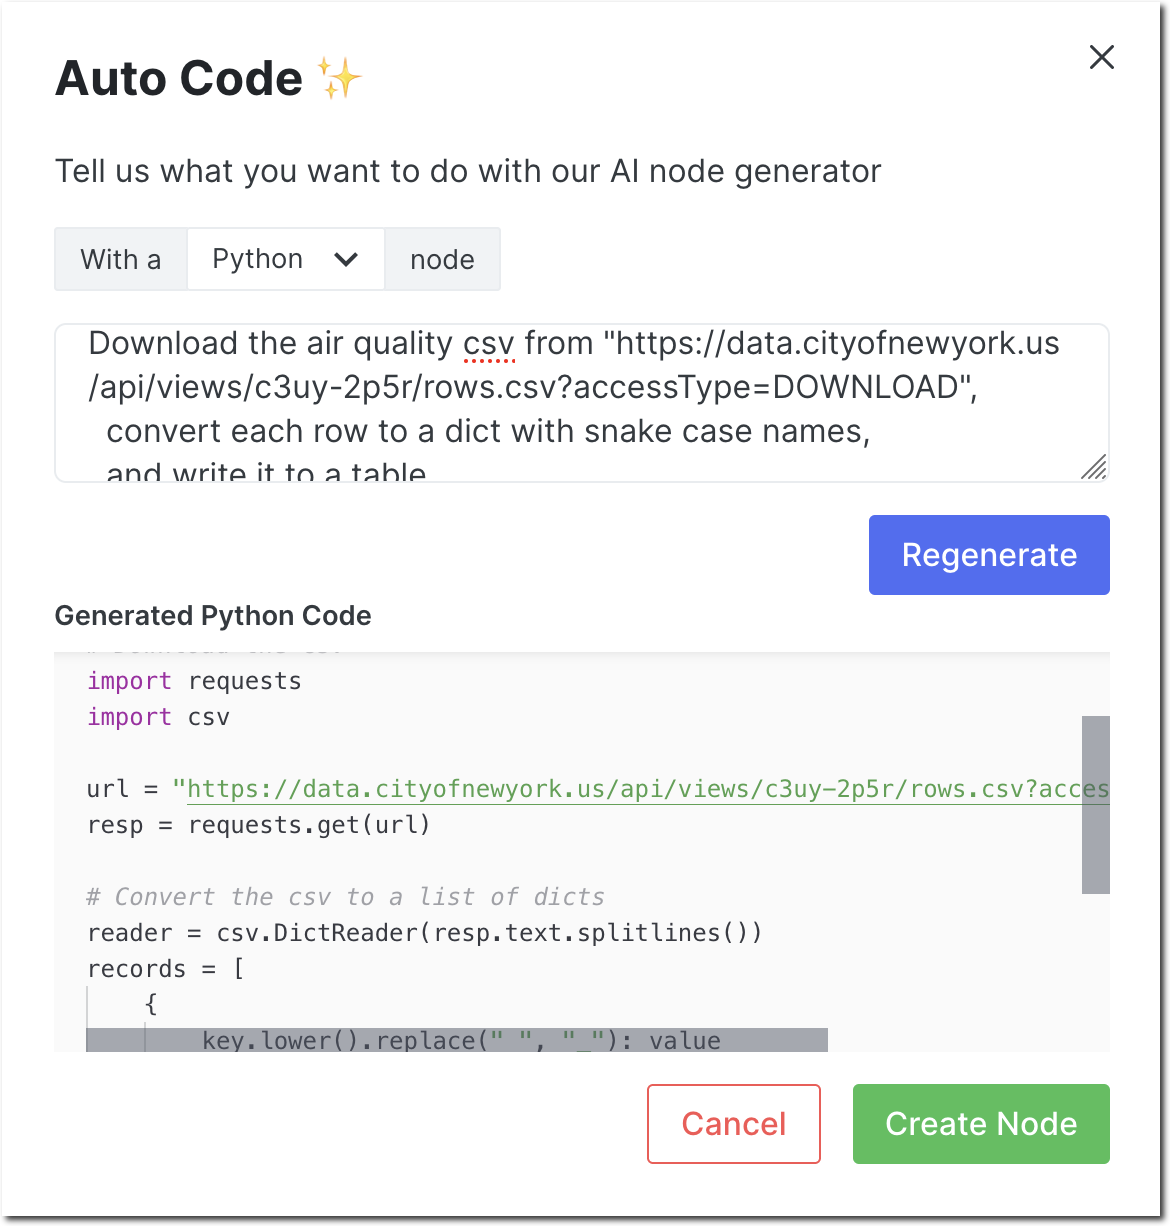
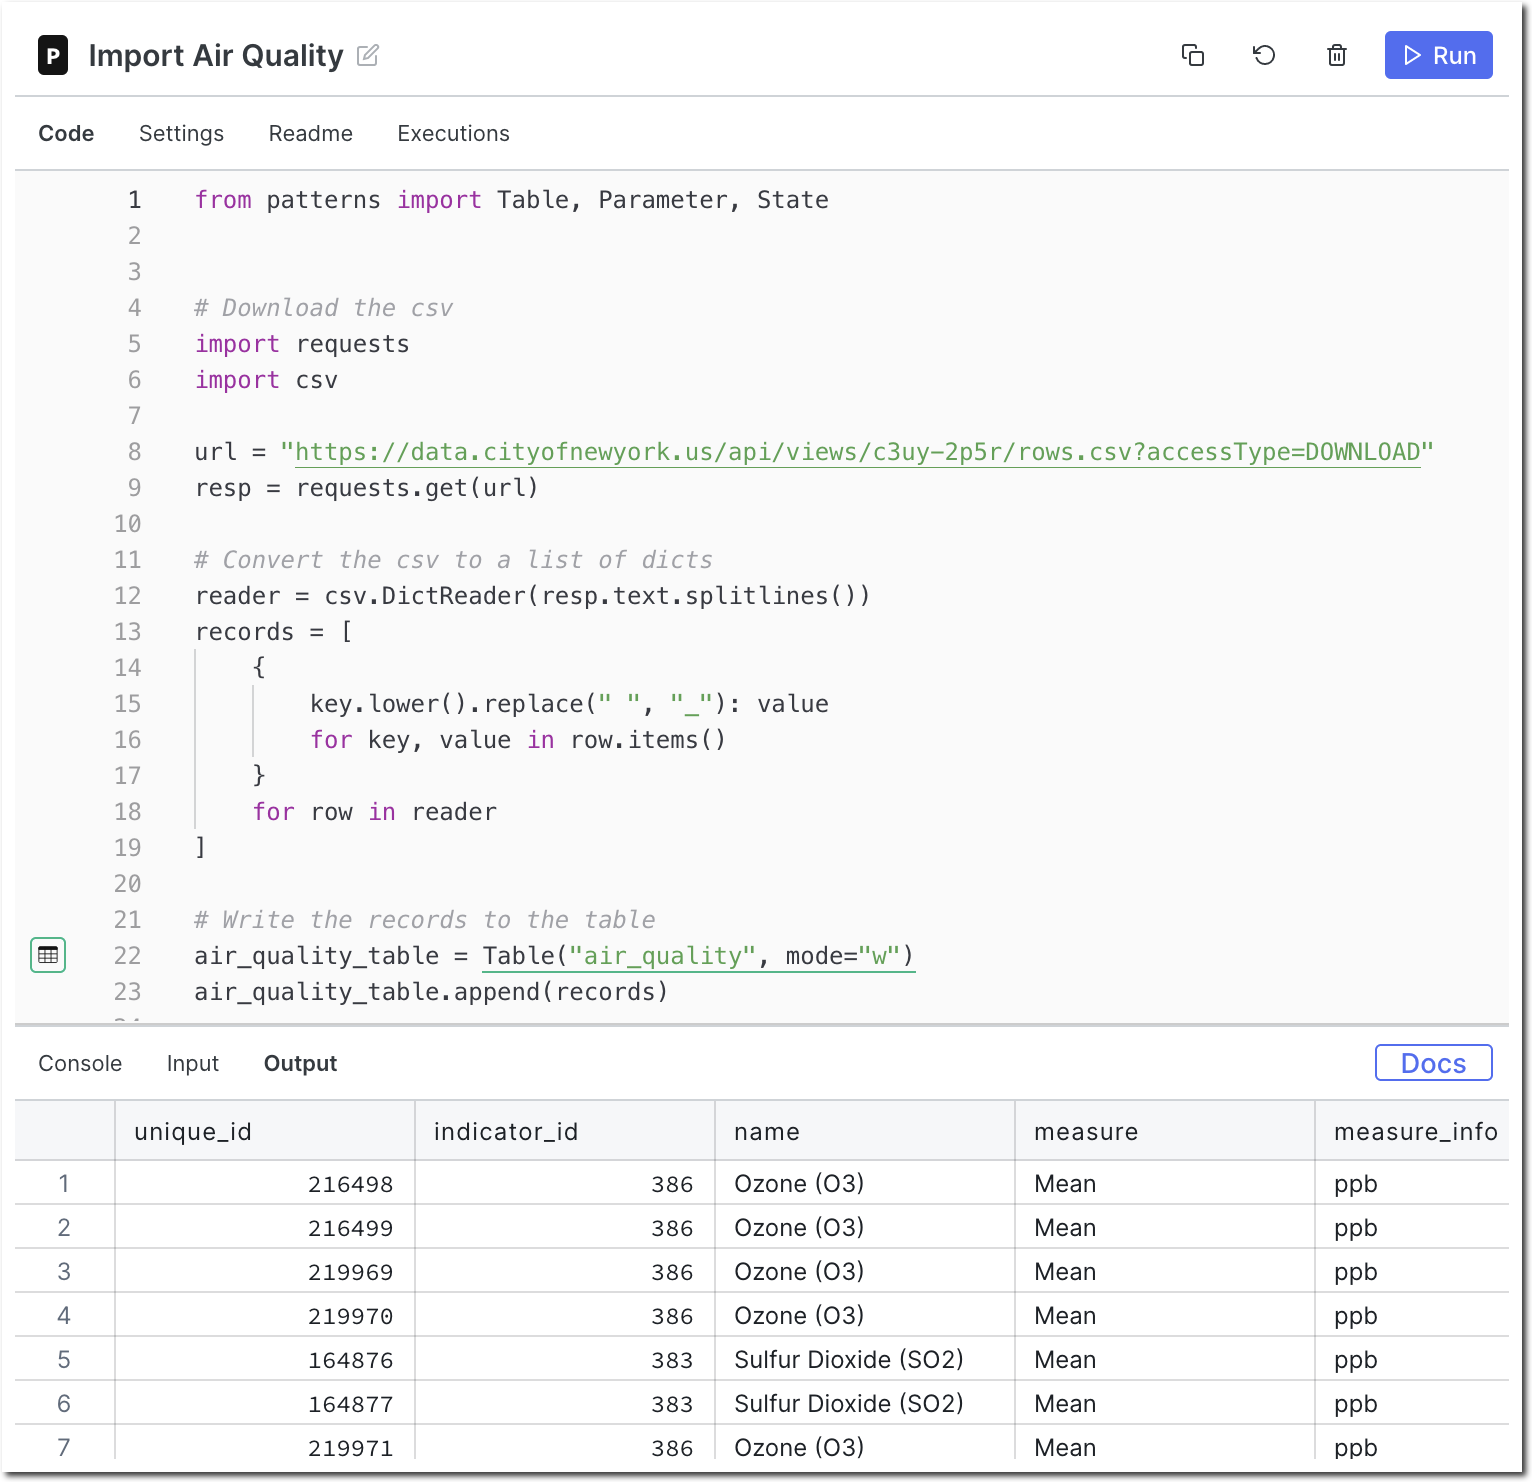
The air quality report is a publicly available CSV. Bring the data into Patterns by using Auto Code to create a Python node with the following text:
Download the air quality csv from "https://data.cityofnewyork.us/api/views/c3uy-2p5r/rows.csv?accessType=DOWNLOAD",
  convert each row to a dict with snake case names,
  and write it to a table
Configure the output store for the newly created node and Run it. If all goes well,
Patterns will import the CSV and create a table called air_quality.
Find min and max sulfur dioxide values
Now let's find out the minimum and maximum sulfur dioxide values for each place.
(Note: This actually took a few attempts to get right, because there are somewhat
similar names in the data we're examining, name and place_name.)
Open Auto Code to create a SQL node with the following text:
Get a list of all air quality records and
calculate the min and max data value for each place name,
but only if the name starts with Sulfur
sort by the max value
Run the node to execute the generated SQL. You should see something like this:
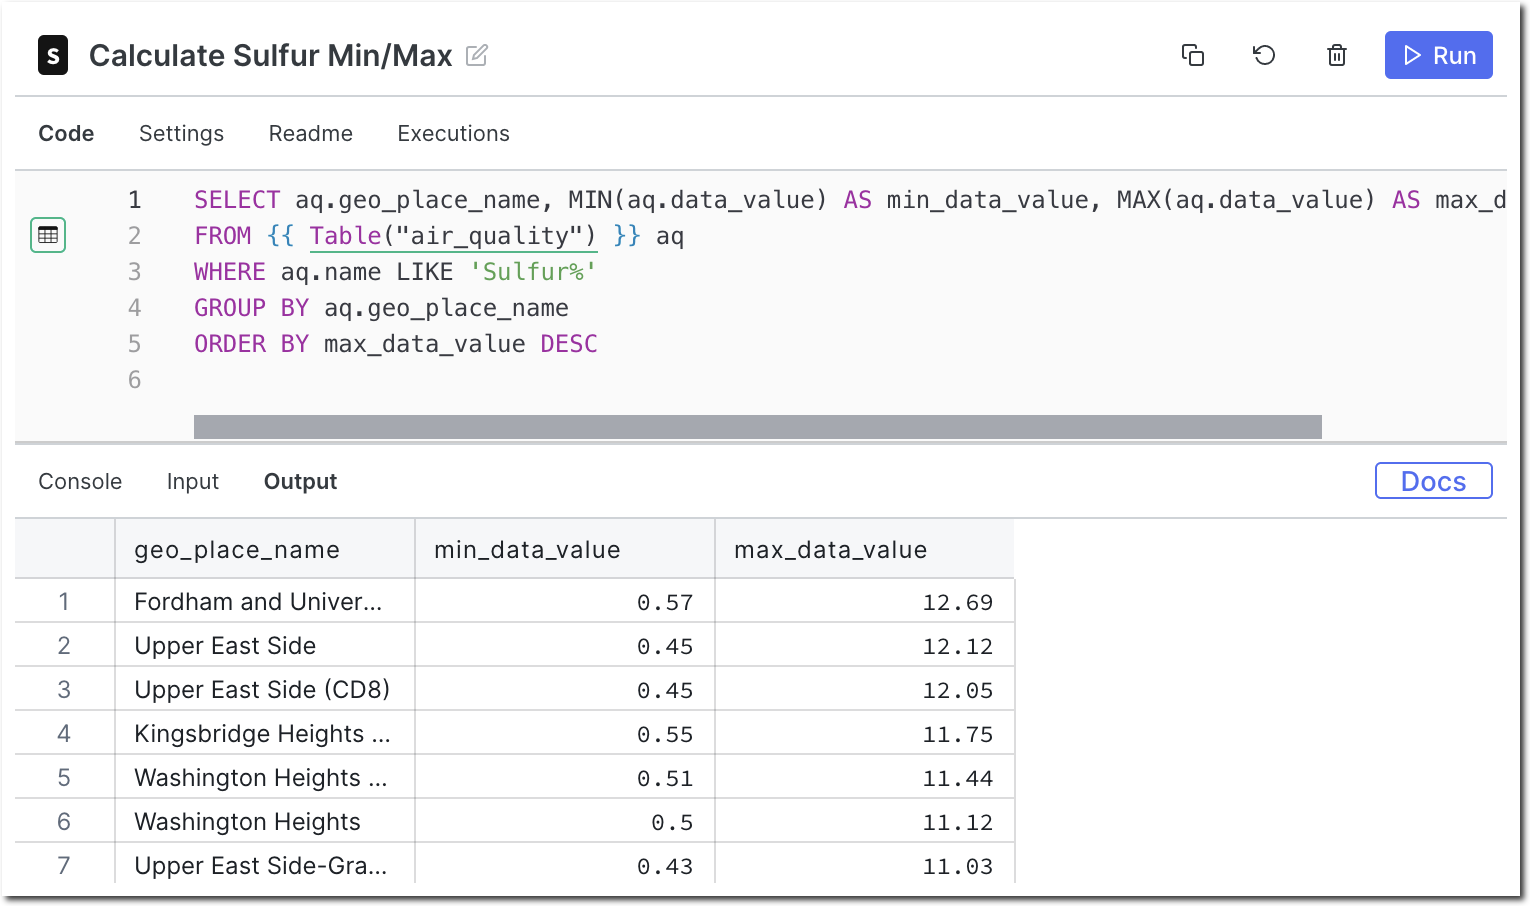
Notice that Auto Code automatically understands which tables to pull data from and which columns are needed to satisfy the request.
Behind the scenes
So how does Auto Code work? How does it know which tables, columns, and APIs are available? The answer lies in how the prompt is created and sent to OpenAI.
Generating Python nodes
To generate Python nodes, Patterns creates a prompt which augments the user's input with:
- a list of all the tables and fields within a graph
- a list of commonly used functions in the patterns-devkit library
- an example of a user input + possible answer
- the real user input and beginning of the answer
An example prompt sent to OpenAI might look like this:
SQL tables (and columns):
* output_table(geo_place_name, min_data_value, max_data_value)
* air_quality(unique_id, indicator_id, name, measure, measure_info, geo_type_name, geo_join_id, geo_place_name, time_period, start_date, data_value, message, patterns_id)

The patterns-devkit library:
```
class Table:
    [ ... trimmed ... ]

    def read(cls, as_format: str = "records") -> List[dict]:
        """Read records from this table.

        Args:
            as_format: Format to return records in. Defaults to list of dicts ('records').
                Set to 'dataframe' to get pandas dataframe (equivalent to ``read_dataframe``)
        """
        ...

    def read_sql(cls, sql: str, as_format: str = "records") -> List[dict] | DataFrame:
        """Read records resulting from the given sql expression, in same manner as ``read``.

        To reference tables in the sql, you can get their current (fully qualified and quoted)
        sql name by referencing `.sql_name` or, equivalently, taking their str() representation::

            my_table = Table("my_table")
            my_table.read_sql(f'select * from {my_table} limit 10')

        Args:
            sql: The sql select statement to execute
            as_format: Format to return records in. Defaults to list of dicts ('records').
                Set to 'dataframe' to get pandas dataframe.
        """
        ...

    def append(cls, records: DataFrame | List[dict] | dict):
        ...

    def upsert(cls, records: DataFrame | List[dict] | dict):
        ...

    [ ... trimmed ... ]
```

Python code using the patterns-devkit library that "list all customers with a customer_id of 333":
```
from patterns import Table

customers_table = Table("customers")
results_table = Table("results", mode="w")

records = customers_table.read_sql(
    "SELECT * FROM {} c WHERE c.customer_id = {}".format(customers_table, 333)
)
results_table.append(records)
```

Python code using the patterns-devkit library that "list all air quality rows and print them out":
```
from patterns import Table
Generating SQL nodes
To generate SQL nodes, Patterns creates a prompt with a similar structure to the Python prompt. An example prompt sent to OpenAI might look like this:
SQL tables (and columns):
* output_table(name, min_value, max_value)
* air_quality(unique_id, indicator_id, name, measure, measure_info, geo_type_name, geo_join_id, geo_place_name, time_period, start_date, data_value, message, patterns_id)


PTSQL is a SQL dialect that is identical to PostgreSQL, but references tables differently.

A PTSQL query that "list the row_ids from a table named Foo":
```
SELECT f.row_id
FROM {{ Table("Foo") }} f
```

A PTSQL query that "get a list of all air quality records, calculate the min and max data value for each place with a name starting with Sulfur":
```
Why conversational interfaces?
Software is complex, despite our greatest attempts at simplifying it. Products promise great power, more productivity, and simpler lives for their users. But the reality is that most of us are not experts in the tools we use, because becoming proficient in any tool takes time and effort. The primary barrier for people to succeed with any tool is the learning curve.
So how do products attempt to solve this barrier to learning?
- Teaching
- documentation
- tutorial videos
- blogs
- community forums
- Expert-created starting points
- templates
- components
- UI helpers
- wizards
- auto-complete / intellisense
- coach marks
- contextual help
Enter the conversational interface
Conversational interfaces are a new(ish) way to interact with software, and they help reduce the barrier to learning by allowing software to understand written human intent. They are a natural extension of the way we communicate with each other. Ask a computer to do something as you would ask any other person.
Search engines originally pioneered this type of interface a long time ago. When search was
first introduced, it was largely based off simple keyword matching indexes.
Google: ramen recipe
But as search engines became more sophisticated they began to understand the intent
behind questions, and queries became more conversational.
Google: how do I make the best ramen?
Now, these powerful interfaces are available to any developer who has access to a Large Language Model (e.g. from OpenAI, Google, etc.).
Expect to see an explosion of conversational interfaces in the coming years! Software is complex, but if it can understand human intent, it will reduce the learning curve and remove barriers to success.