My goal for this blog was originally to create a bot to follow crypto whales. It's a popular strategy due to the abundance of transparency in blockchain networks. Accounts like @whale_alert make it easy to follow this activity. However, crypto whales actually have many options available to them to sell their crypto long before they move their coins on-exchange such as crypto derivatives on Binance.
🚨 15,000 #ETH (23,708,060 USD) transferred from unknown wallet to #Lido
— Whale Alert (@whale_alert) January 30, 2023
https://t.co/7VthxdFnc4
I recently read an article in favor of the whale watching arbitrage. While there may be some cherry picked cases where it indicates volatility, an important property of a crypto trading bot is a large sample size of data and frankly crypto whale movements are fairly sparse.
Depending on your definition of a whale there is either an abundance of whale transactions, so many so in fact that there is no correlation. Or, there are so few that we only have 2 events in history where we can really observe the effect of whales
Collecting Whale Data
I ended up needed to take a couple of approaches until I was finally able to scrape whale data from the internet/blockchain.
Attempt #1: Webscraping Whale Alert
My first instinct was to use the Whale Alert. However their service is paid so I looked to the twitter account which is free.
Whale alert has an inconsistent tweet format, but the core information of their whale alert tweets are consistent enough to make a regex for. Essentially it goes
[comma seperated number] #[numbers & upper case letters] ( [comma seperated number] USD ) [any text]

[link to whale alert]
For this formula I just used one space to denote whitespace, but it could be any amount of whitespace so for the regex I will match ≥ 1 whitespace characters instead of just a space
I decided to use webscraper.io to scrape them instead. In about 10 minutes I had it automated and scraping their twitter page.
… but twitter capped me once I went back to December 5th ☹️
It turns out webscraper.io is slower than manually just scrolling through their twitter feed because for some reason webscraper.io scrolls back to the top every time it tries to scroll to the next “page” in twitter’s infinite scrolling.
Attempt #2: BlockSci
Using BlockSci to query to the block chain, and then requesting from whale alert’s website based on large transaction hashes to attach whale alert’s metadata to the transaction. We can request https://whale-alert.io/transaction/ethereum/[txn hash] and it will tell us metadata about where the transaction is from and where it is to. We care if the transaction is to an exchange, like coinbase or binance. For this specific example we are also not concerned if the transaction is between two unknown addresses.
However, a cloud provider would likely need to be used due to the enormous RAM, disk and compute required to run BlockSci since it is no longer publicly hosted. Additionally, whale alert’s public history does not go back very far in history.
Attempt #3: AWS Athena Queries (🏅winner!)
It turned out that AWS has some open data on this. I followed this guide and used AWS Athena to query the BTC & Ethereum transactions for large transactions
Note!! Later we will reduce the number of columns we are querying to only the ones we need instead of * . This will save an enourmous amount of time and cloud computing costs, so I recommend not running the follow select * queries just yet. Hold on until we reach the more refined queries 🙂.
Here are some queries I used for finding large (whale) transactions:
Filtering for large BTC transactions (queried 340GB):
select
    *
from btc.transactions
where
    block_timestamp > from_iso8601_timestamp('2019-01-01T00:00:00.0Z')
    and value > 5882.35294
(≥ 5882 BTC because at current market price that would be a move of ≥$100M USD)
Filtering for large ETH transactions (queried 77GB in 12.6s) :
select
    *
from eth.transactions
where
    block_timestamp > from_iso8601_timestamp('2019-01-01T00:00:00.0Z')
    and (value/10000000000) > 7246376810000
(units for value in AWS’s transactions records are wei. 72463768100000000000000 wei = 72463.7681 ETH ≈ $100M USD at market price today)
Analysis of the query results
AWS Athena stores your query results in AWS S3, so you can use a patterns component to import the CSV directly into Patterns! I also wrote a python node to automate downloading Binance’s daily, 5 minute and 1 minute data and import it to a patterns table.
I joined the whale transactions with the BTC Prices using a patterns SQL node. I fiddled with the threshold for a whale transaction by adjusting the minimum number of bitcoins required. 10k BTC was too low and happened practically every day for the last 3 years, 20k was high enough to begin seeing some interesting patterns. Observe:
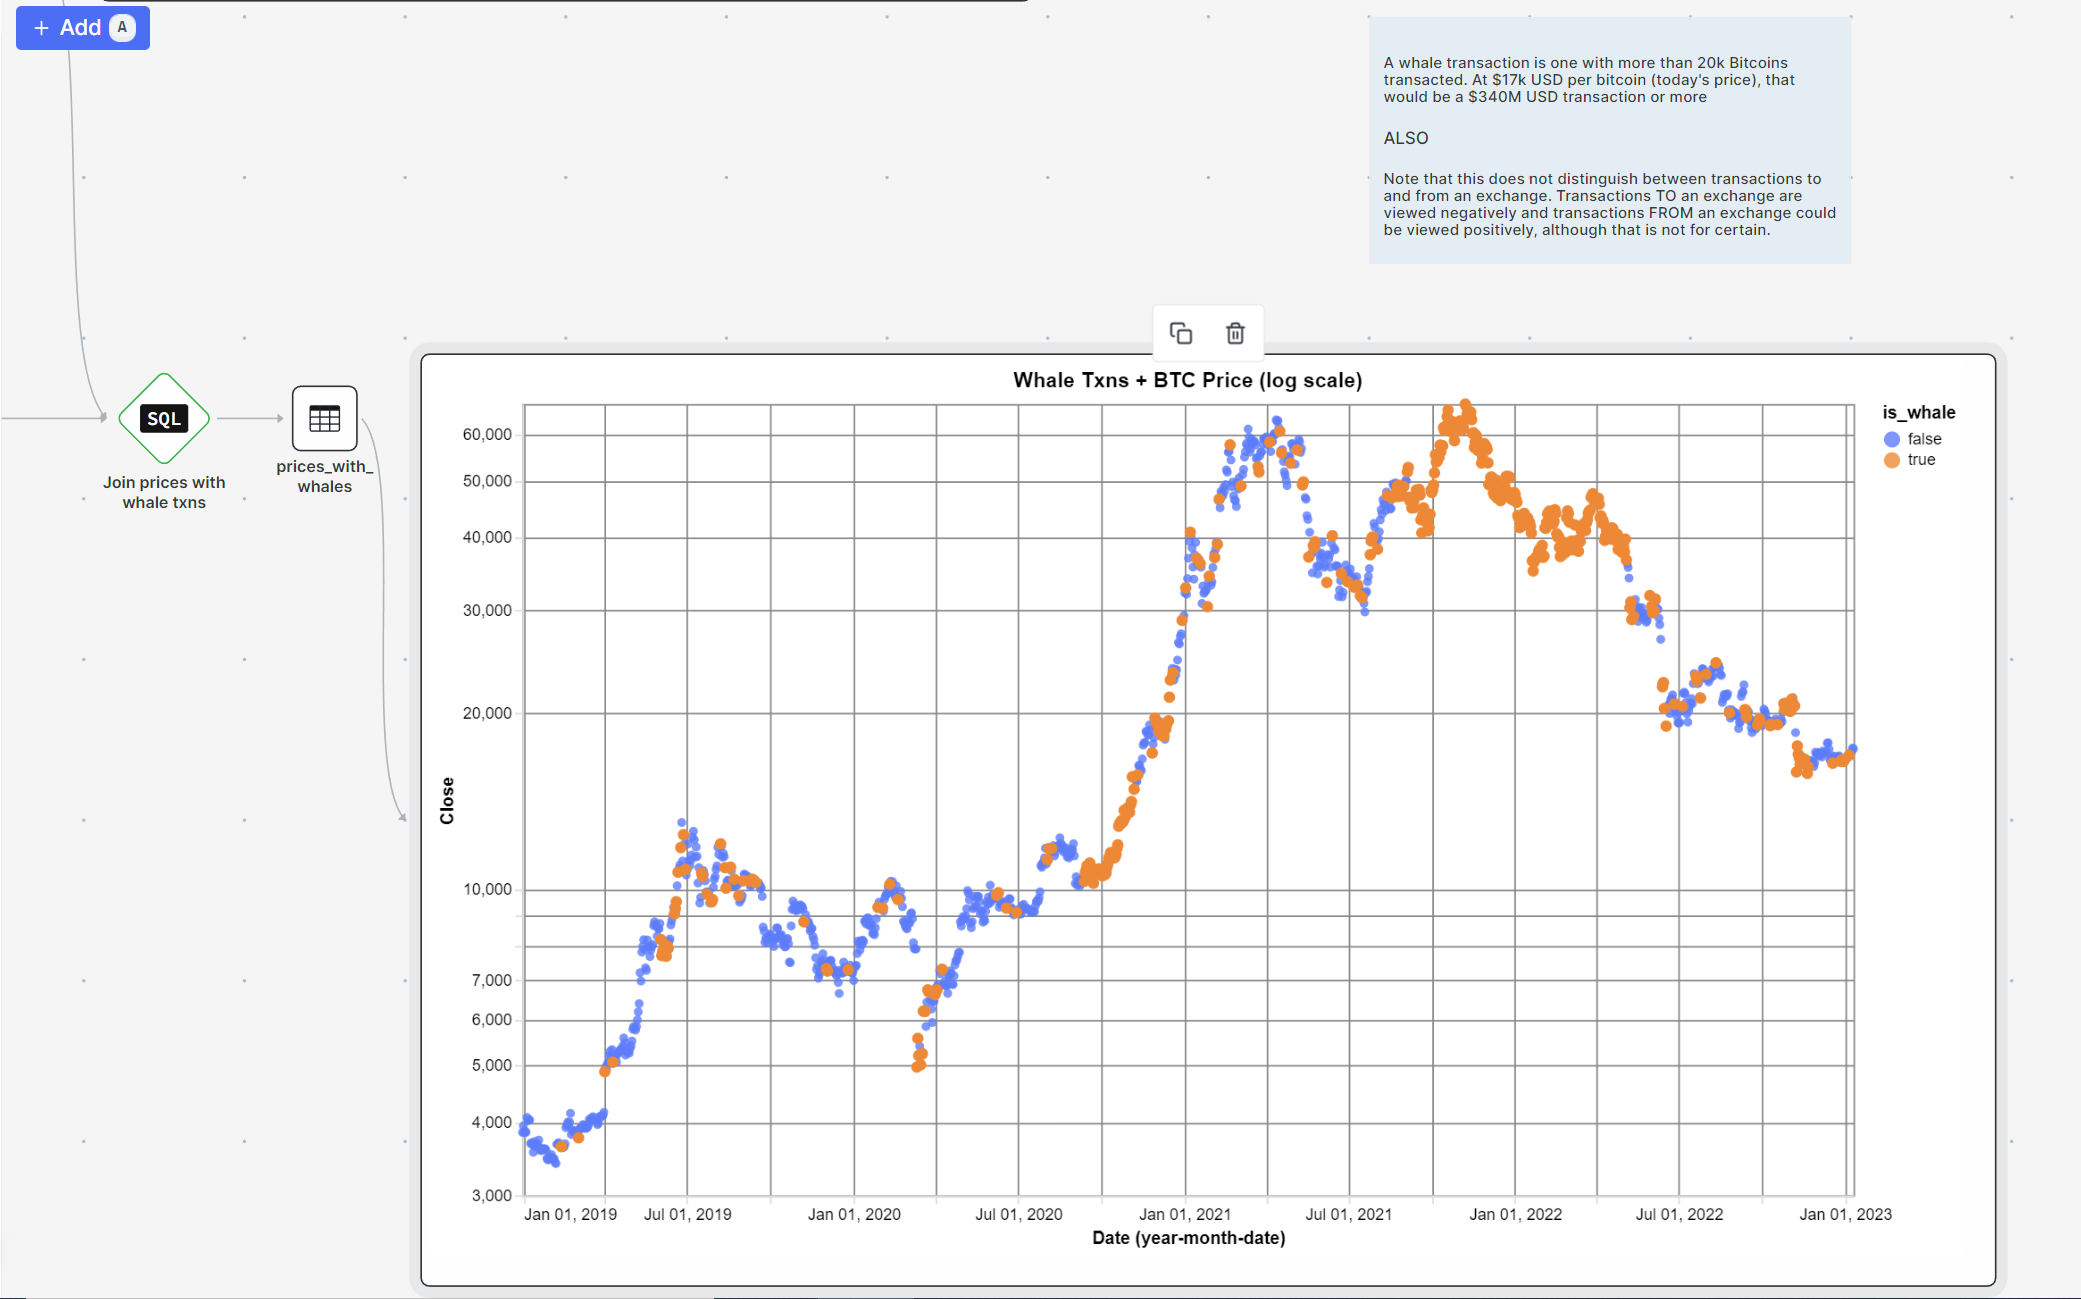
Of course we are eyeballing this, but on a macro scale (over a relatively small period of 3 years mind you) it appears that there is some correlation between weeks/months of back to back whale transactions and market volatility, both in the up and down direction.
What could be even more interesting is tracking the direction of these transactions. For example, whether or not they are to/from an exchange. If $1B USD in BTC is sent to coinbase, that might not be such a good sign and may provide more signal compared to 2 whales exchange $1B BTC, or exchanging a smaller amount like $300M BTC. But for a quick litmus test to see if this data is potentially actionable, this chart provided fast insight and inspired me to keep digging.
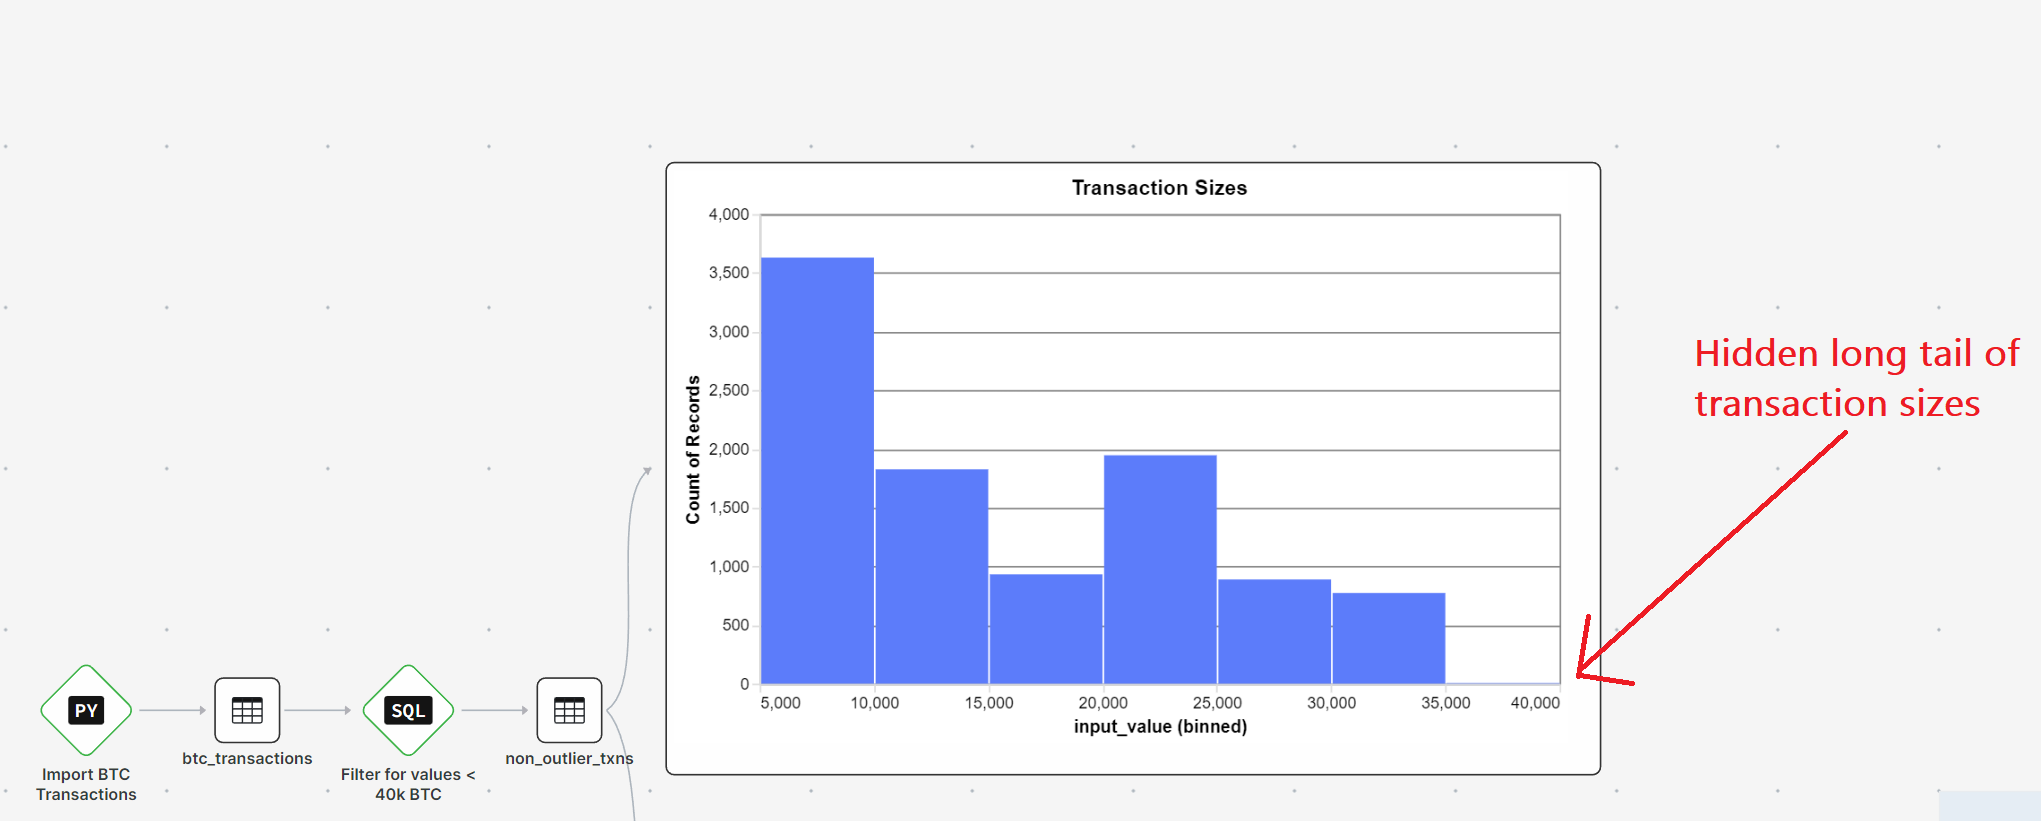
Going Deeper: Looking into the Network’s daily volume
select
    sum(input_value) as network_volume,
    date(block_timestamp) as date
from btc.transactions
group by
    date(block_timestamp)

Note: By reducing the number of columns in my output query, Athena scanned far less data thus decreasing my bill 56x !!! This is really cool.
Here is the new query I used to get the whale transactions since inception:
select
    count(1) as count,
    sum(input_value) as total_whale_volume,
    date(block_timestamp) as date
from btc.transactions
where
    input_value > 20000
group by
    date(block_timestamp)

^much cheaper with selective fields 🤩
Now my join looks a little different. Instead of doing the aggregations and filtering downstream, we did the aggregations upstream. However, we can still do some filtering on the BTC whale transactions. See next:
with whale_timestamps as (
    select
        count,
        date
    from {{ Table("all_time_big_whales") }}
    where
        count > 10
)

select
    btc_prices."Date",
    btc_prices."Close",
    case
        when whale_timestamps.count > 0 then true
        else false
    end as is_whale
from {{ Table("longer_btc_prices") }} as btc_prices
left join whale_timestamps
on btc_prices."Date" = whale_timestamps.date
I can observe the number of whale transactions along with the total value of those transactions. I believe this will be a better heuristic for the market movements and volatility we are trying to predict.
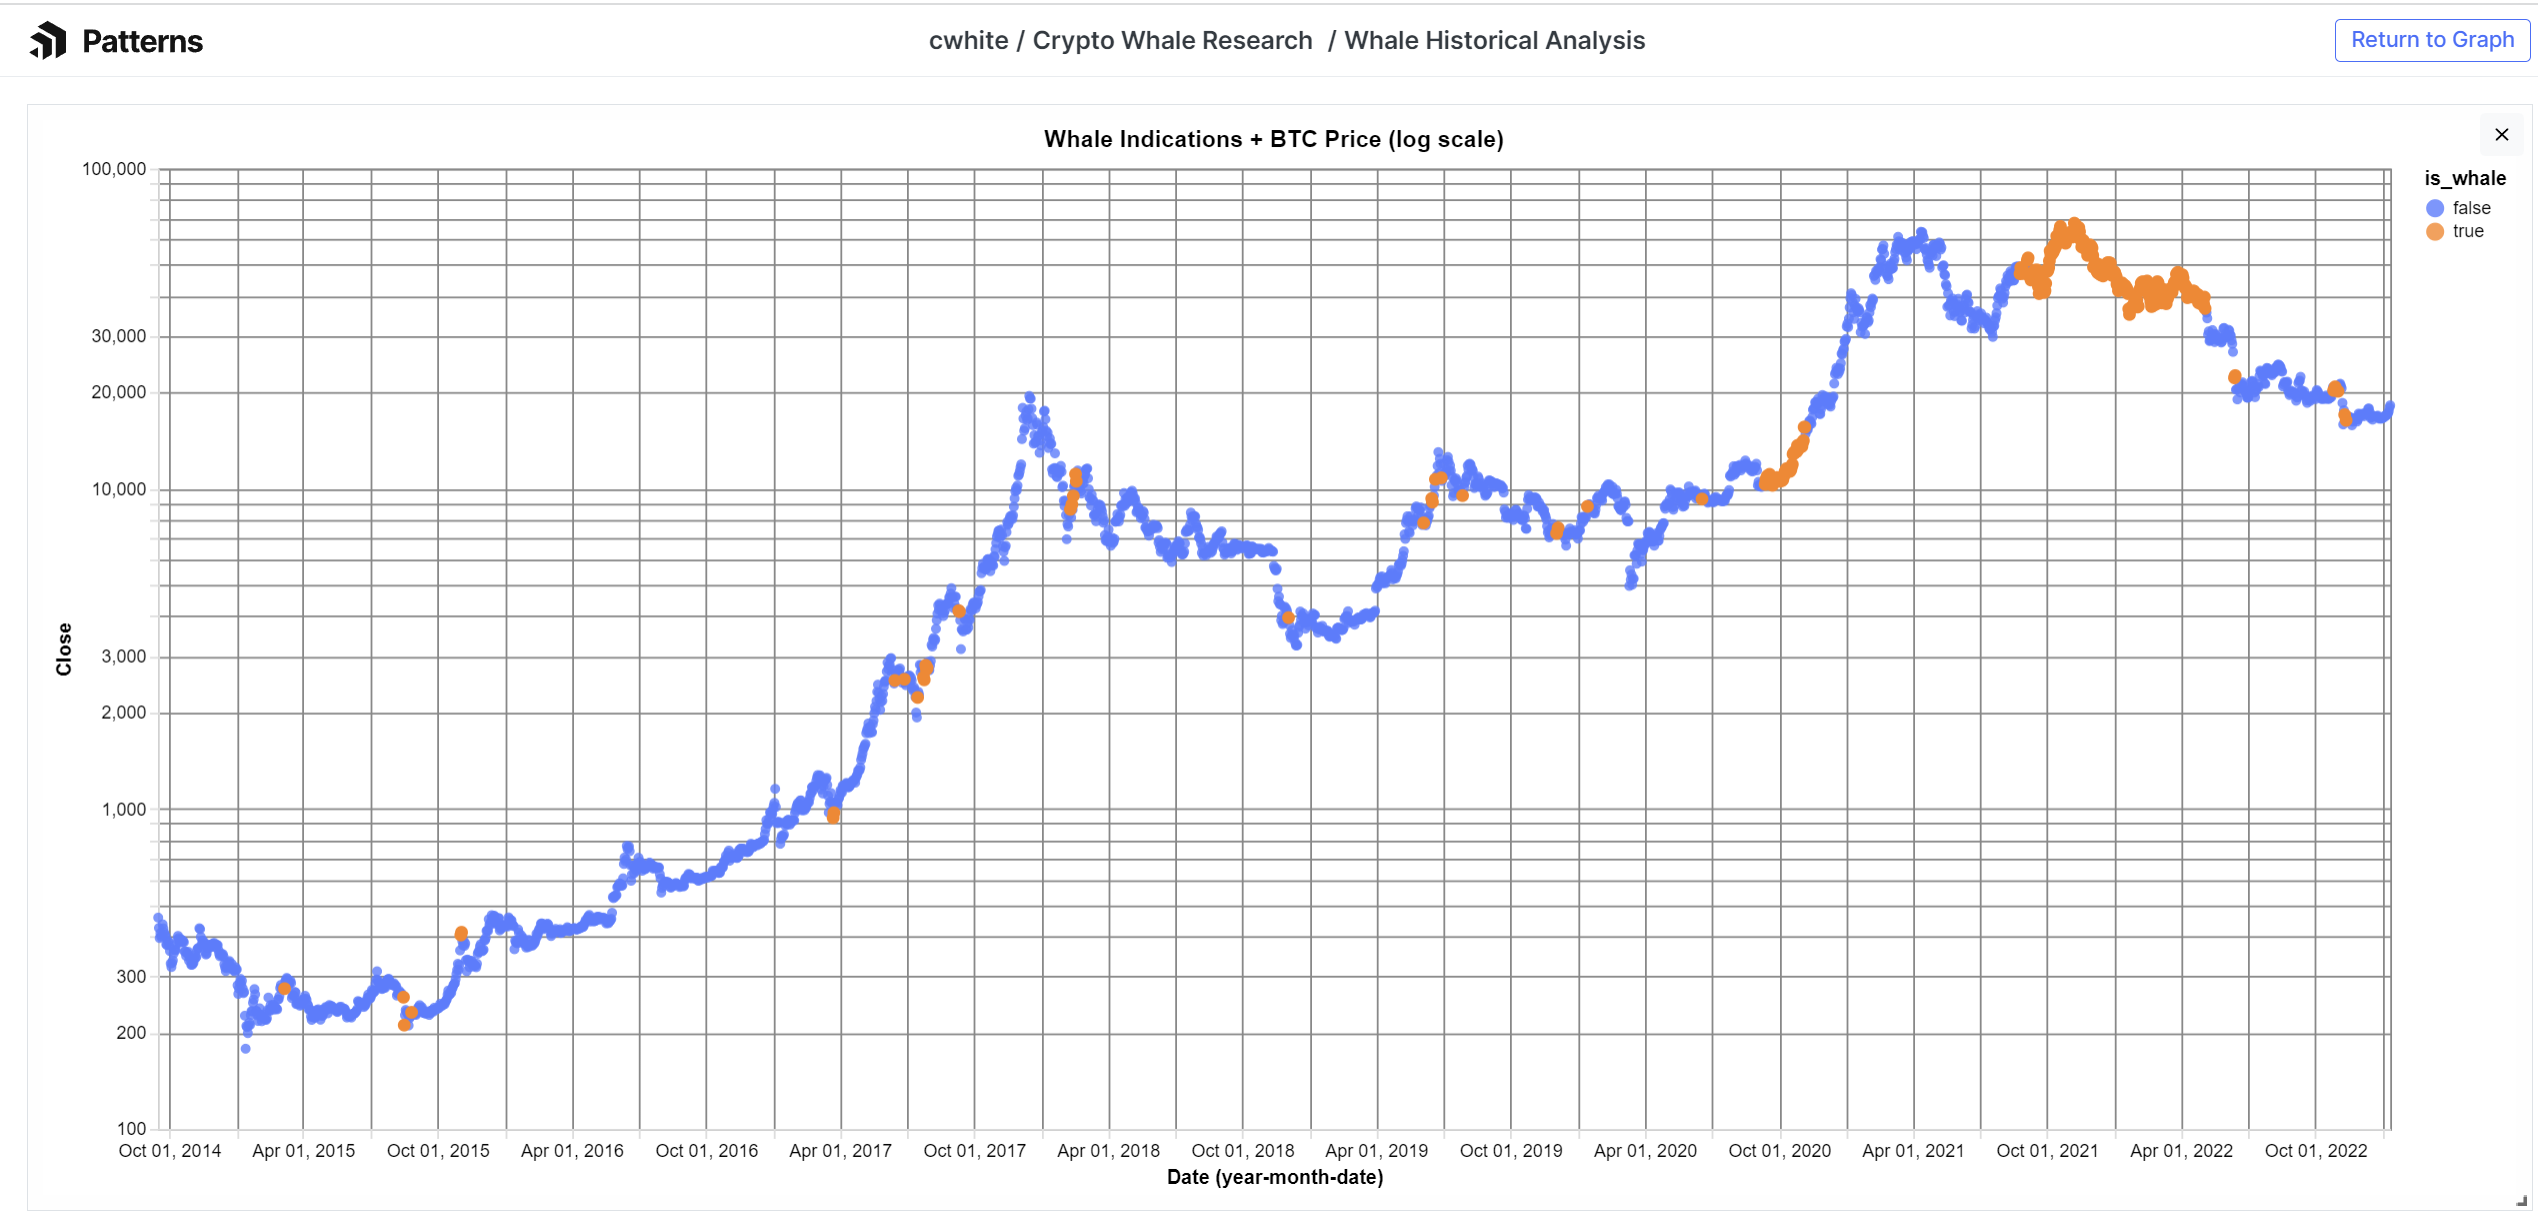
Each orange dot represents a day when more than 10 BTC transactions occurred with values exceeding 20k BTC, roughly equating to $340M USD
Conclusions from Whale Transactions
While this chart may look interesting and seem to predict some market volatility, the price of BTC is always volatile so what we should look for is correlation over a large sample size. Here is that sample:
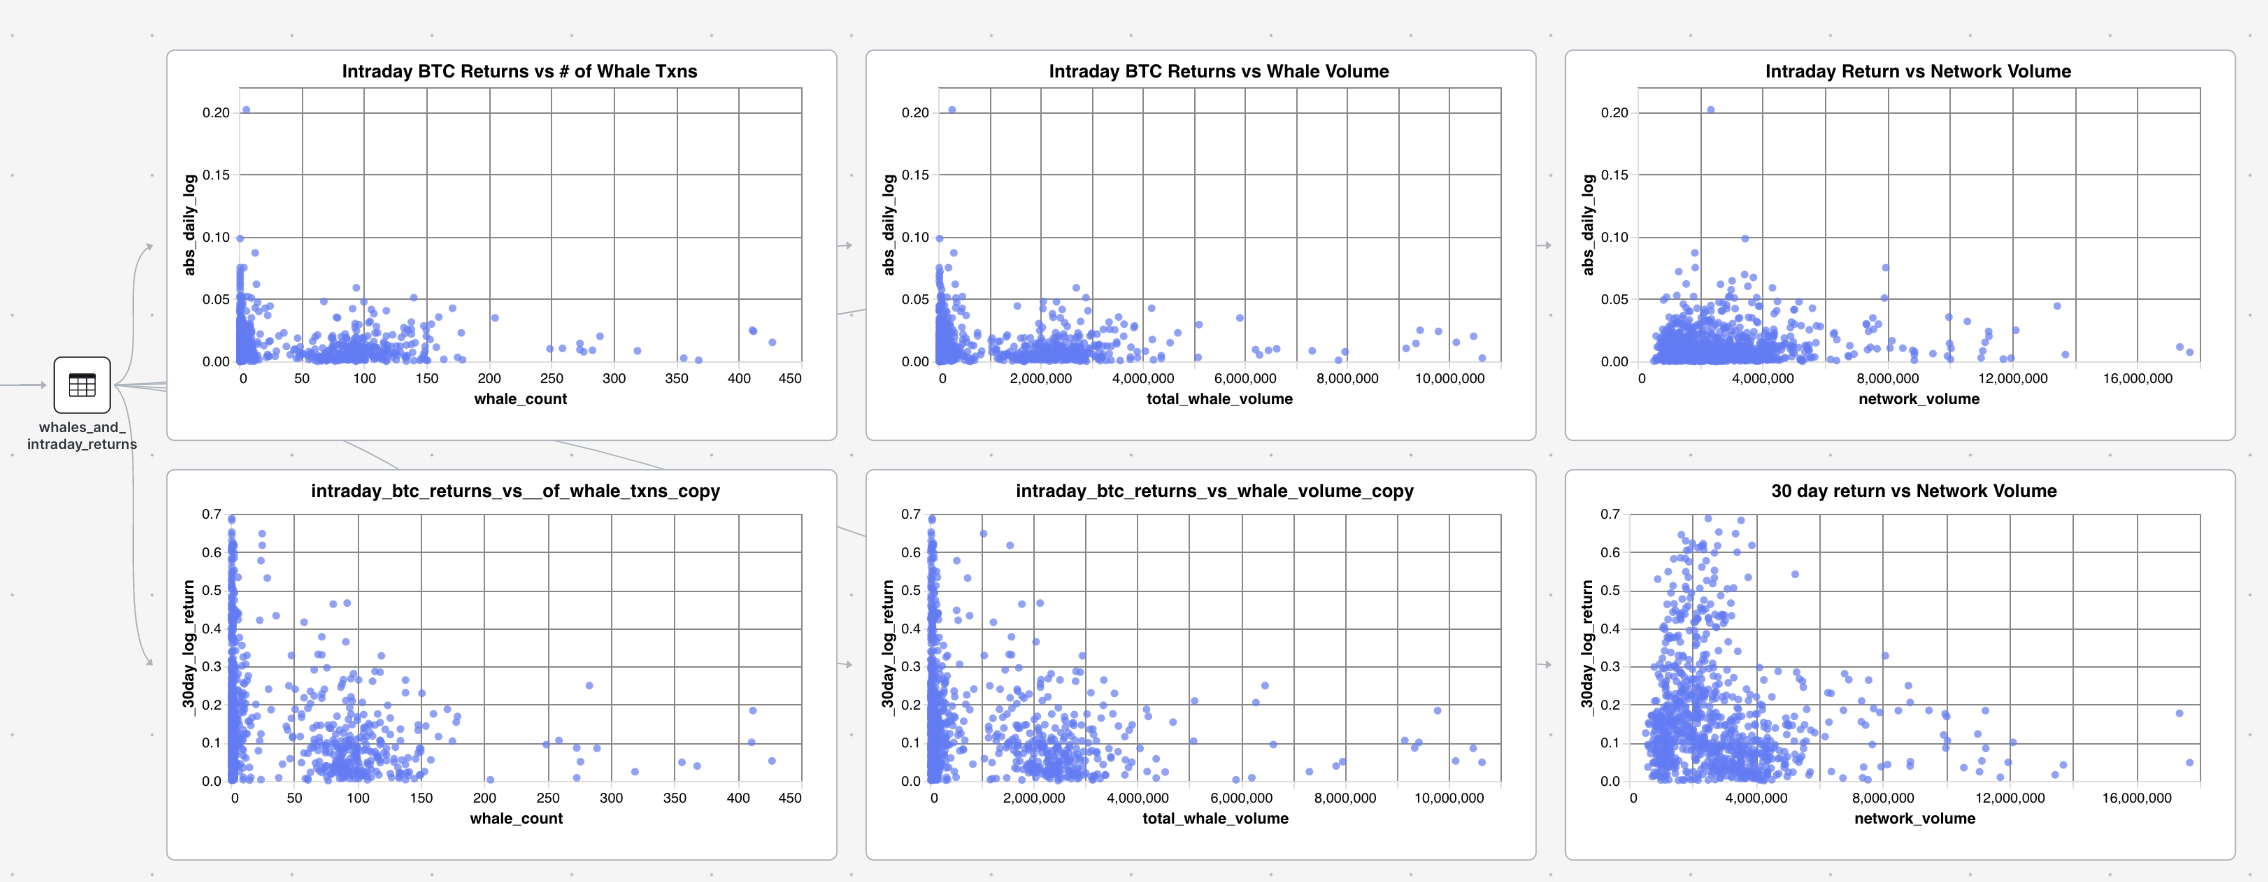
Observing both whale transactions and network volume as predictors of volatility over 1 day and 30 days, we can see that there is absolutely no correlation going on here. It is more or less random
New Idea: Micro Predictions
Going on the theme of whales, let’s dig into the idea of information and delay of information in the network. Specifically on the time between blocks. Perhaps traders/trading bots cover themselves as soon as a whale transaction occurs. They could even be looking at the block that is currently being mined to front run this strategy. Maybe we want to trade based on the block that is currently being mined since the network is essentially in a stand still until the next block is found and that chunk of transactions is processed.
For this I took the block data and queried for the time between them. Then I joined that data on the price data for the time the block is found
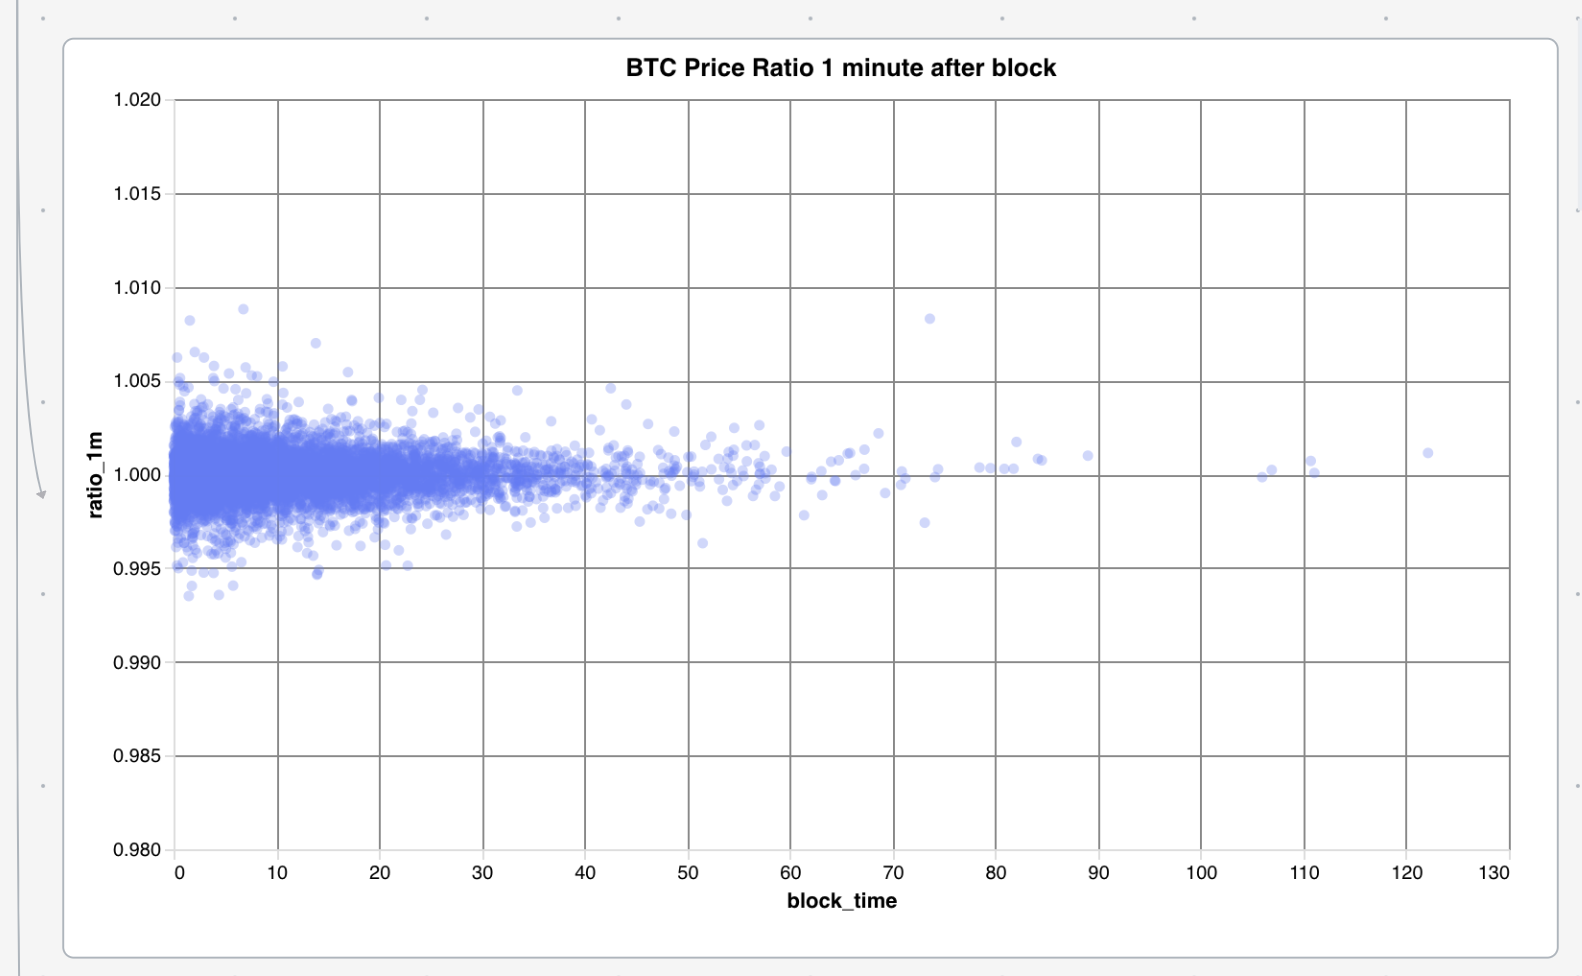
There is not a particular trend that the spread of the returns narrows as the block time increases. However, we have less data for long block times, so it could just be that we don't have enough data and that is why the distribution appears to narrow with longer block times.
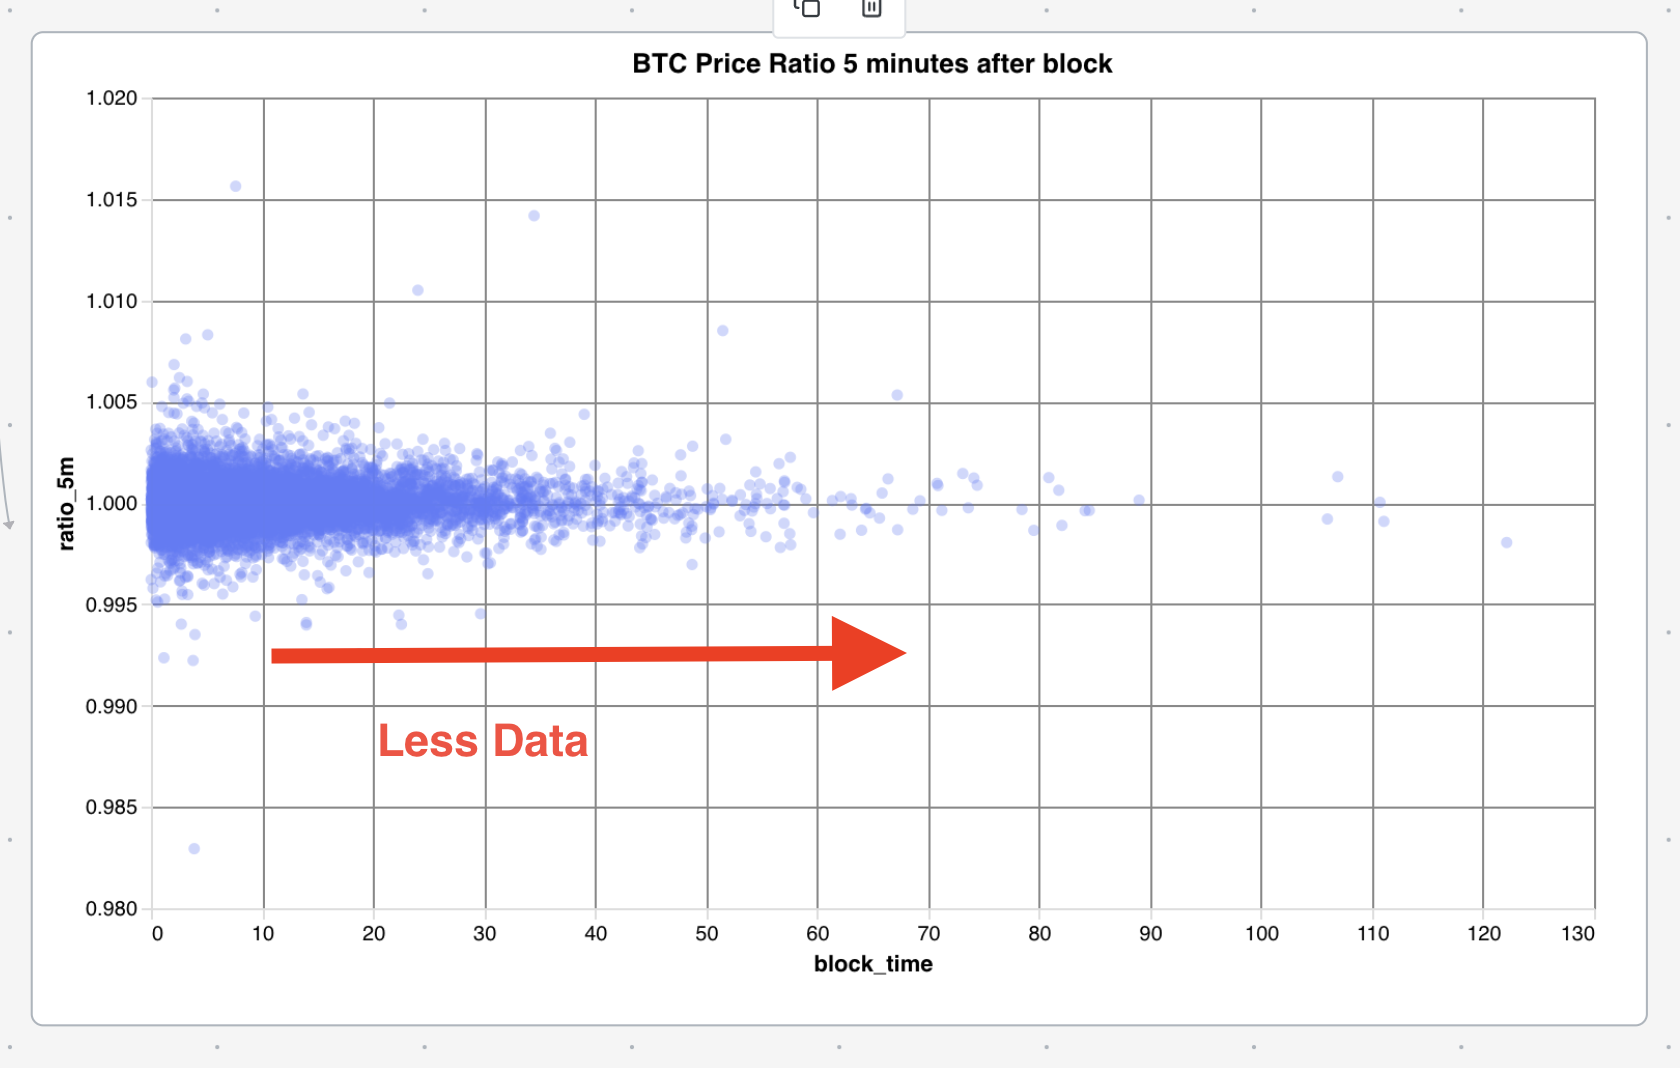
Although there is less data towards the tail we will continue the analysis to try and observe if there is a strategy that can be formed here.
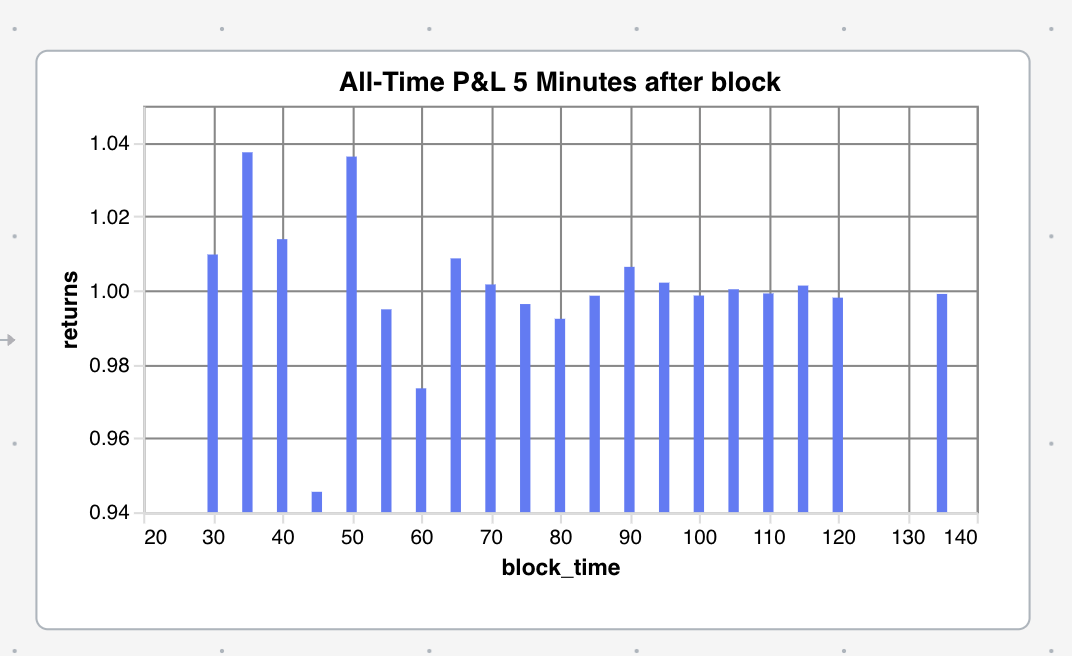
Below is the result of multiplying the ratios partitioned by the block time (grouped in 5 minute intervals). This essentially is telling us what the return is of buying immediately after a block_time of [n] minutes and selling after 5 minutes is over the last 3 years. Since most of the block times are short it makes sense that the returns are negative since the crypto market has overall lost money over the last 3 years. However, what is interesting is the calming ratio as the block times increase. This is in line with the data presented above which shows a narrowing ratio spread as block time increases. This more or less insinuates that the risk premium for long block times should be cheaper. As to why this is, confuses me slightly. My take is that the network is calmer during long block times since there is not an abundance of information being added to the blockchain whereas when the processing times are faster there is more information throughput in the network which creates volatility.
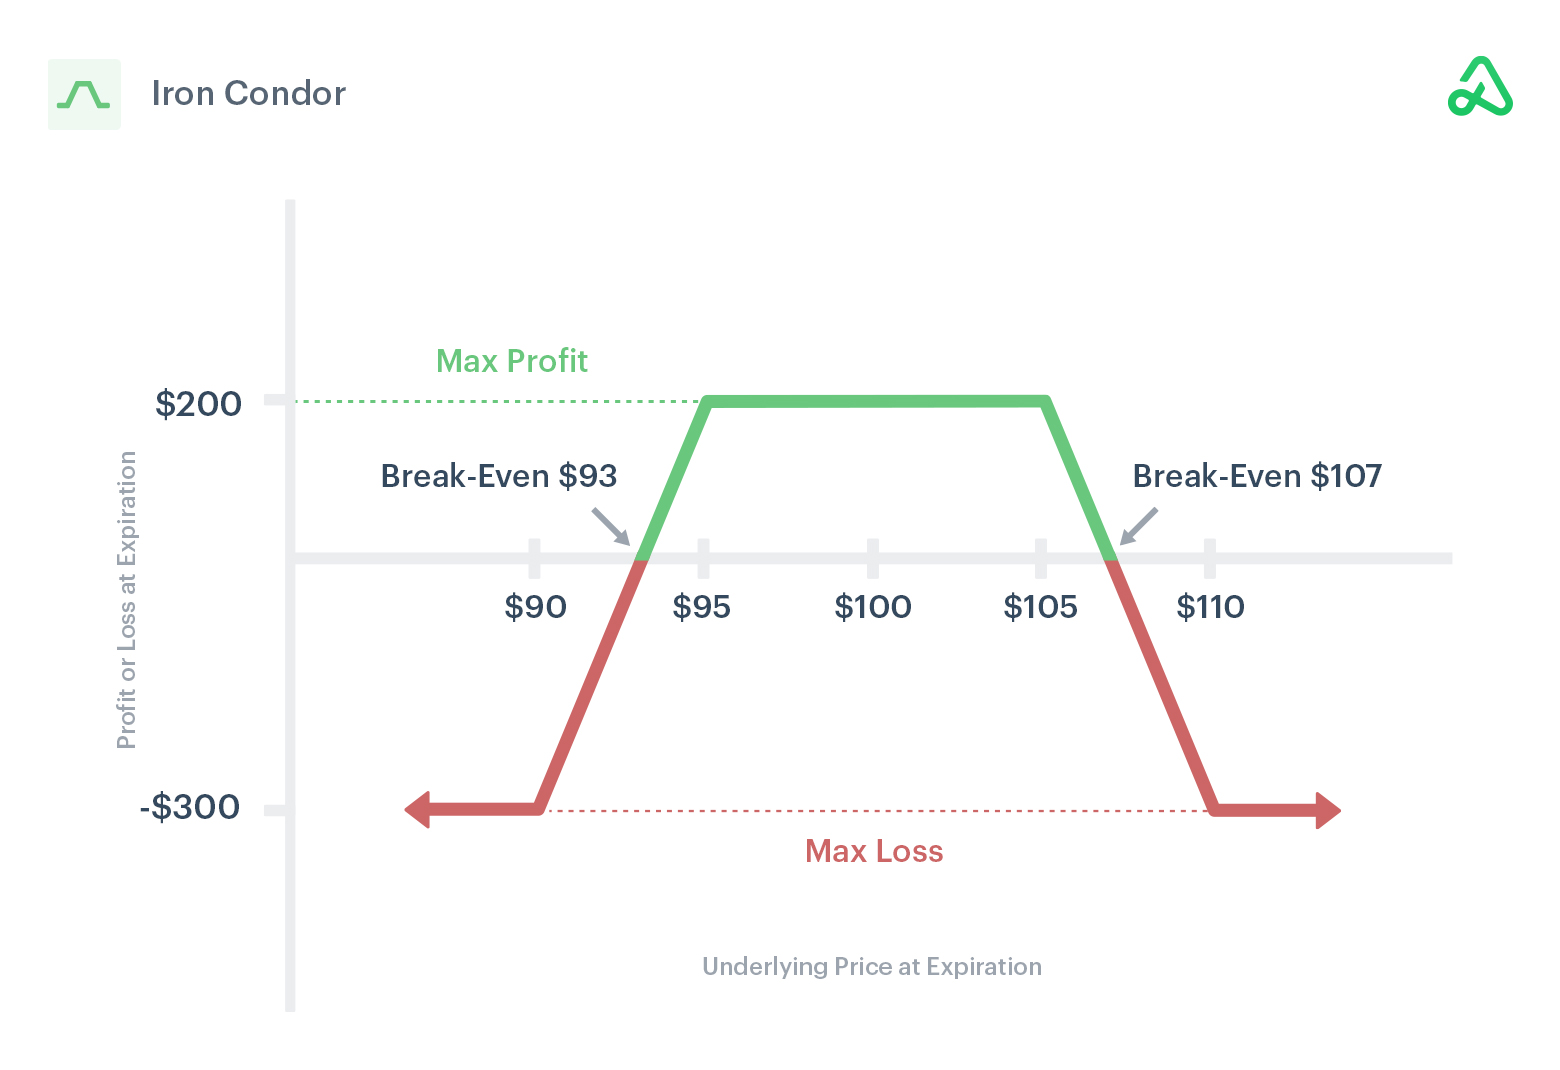
From this I gather that there is potential for an Iron Butterfly options strategy to profit off low volatility. For those unfamiliar, you are essentially selling a combination of 4 contracts that act as insurance against price movement. If not much happens to the price before your expiry you will make money. Here’s a P&L chart for the Iron Butterfly:
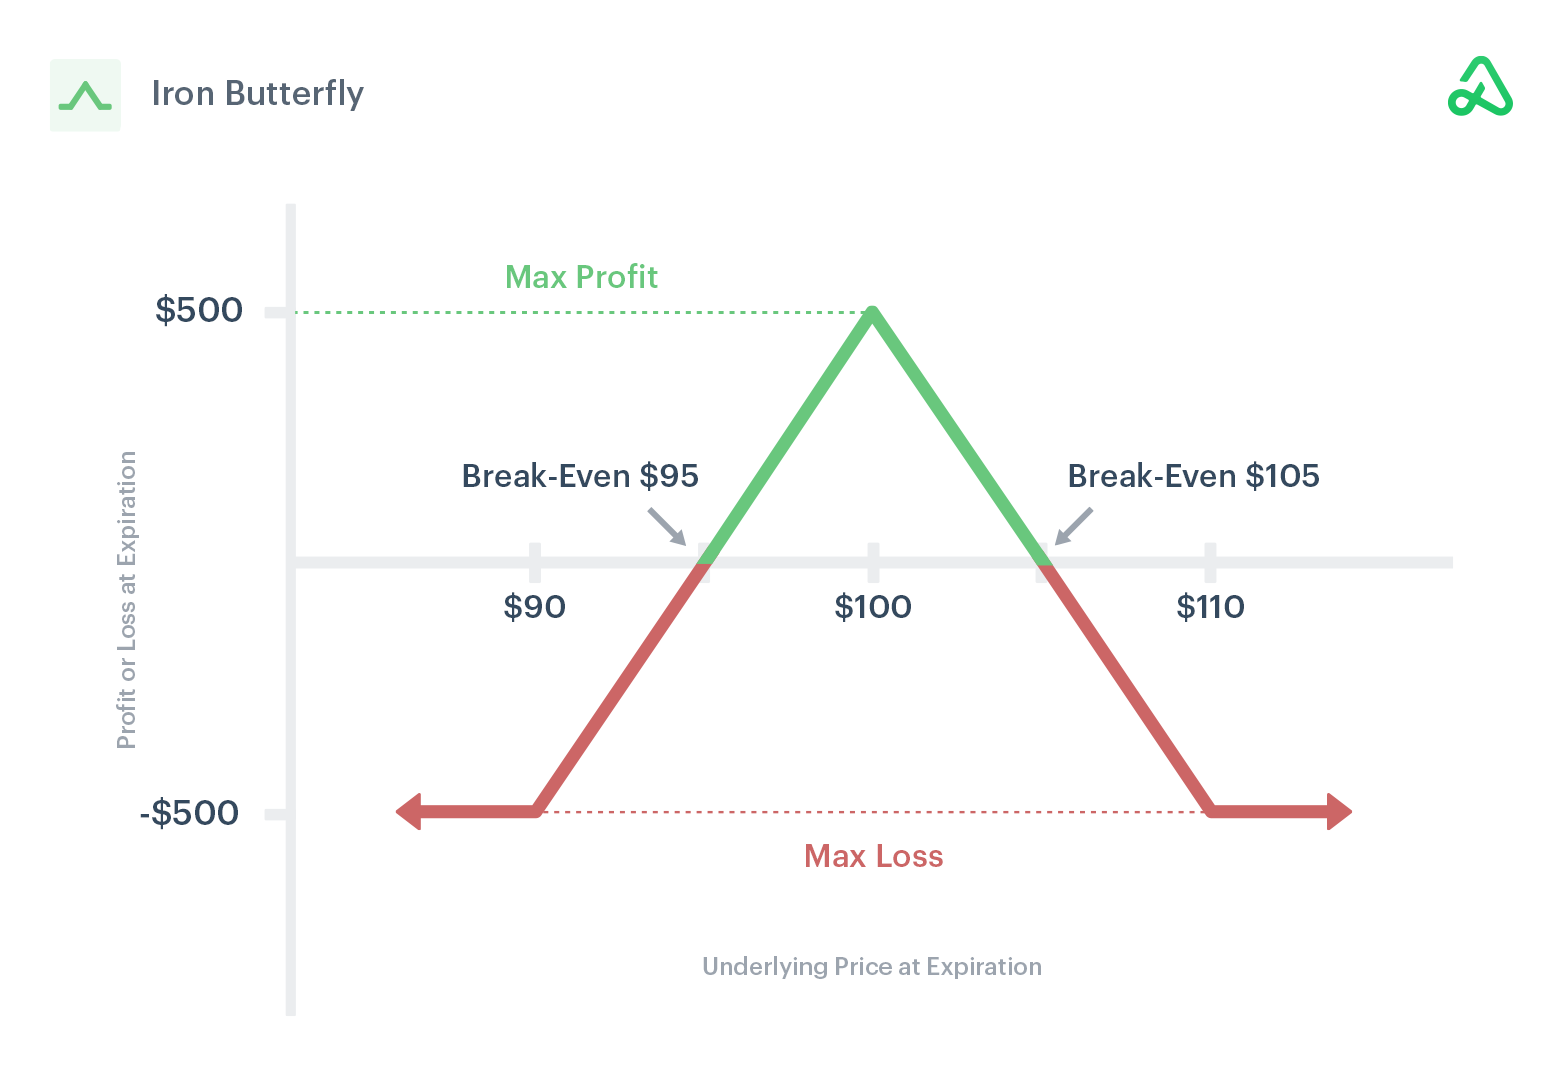
This is also similar to an Iron Condor except we are expecting the price to move so little that it should not be necessary for us to set such a high spread on our price so that we can limit our sunk cost per trade signal.
Implementing the Bot
To implement the bot I used blockchain.info’s API. I polled the durations between blocks every hour and detect when a block is taking more than an hour to trigger a sell for the iron butterfly.
Code from this Blog!
The research for this blog was done with a combination of AWS Athena and Patterns. It can be seen here: https://studio.patterns.app/graph/cw3mbtihqf53fwmwrxzj/crypto-whale-research
The trading bot was also implemented as a Patterns graph and can be viewed here: https://studio.patterns.app/graph/2ounivt9fir1dz8ydyxr/whale-trading-bot
